Even one single candle may signalize that momentum of the market is starting to decline before the next major price change occurs. One of the most famous patterns that demonstrate such a situation is the Doji candlestick pattern. Traders’ knowledge of how to recognize and act on Doji candles in their trading strategies might help them spot trends and reversals better than ever before.
What Is a Doji Candlestick Pattern?
Doji candles represent indecision in the market as, during the trading session, price may have moved a significant number of points in either direction away from the point of where it began, but still close at approximately where it began. The result is a candle that has:
- A very small body (if any body at all)
- Upper or lower shadows (wicks)
- Indecision in the market
Thus, the Doji pattern is regarded as one of the most significant candlestick indicators by traders who use price action to trade. This battle between the bulls and the bears often happens directly before the following:
- A trend reversal
- A trend continuation
- Market consolidation
- A significant increase in volatility
Why Are Doji Candles Important In Trading?
The importance of the Doji candle is tied to the fundamental principle that all financial markets trade due to demand or supply imbalances. The formation of a Doji suggests that either the momentum has diminished, or the uncertainty has increased.
When looking to make profit with trades based on Doji Candles, professional traders use Doji candles to help determine a potential movement in the financial markets. It is also important to note that all trades based on the formation of a Doji can not be made strictly on the signal.
This is the reason why many traders will combine Doji analysis with general technical analysis tools and risk management procedures. Also, price action trading strategies provide insight into how candlestick psychology influences market activity.
This includes:
- Exhaustion of an Existing Trend
- A Potential Reversal at a Critical Point
- Psychological Changes in the Market
- Decreased Momentum
- Hesitation by Institutions
Psychological Meaning of a Doji Candlestick Pattern in Forex Trading
Understanding the psychology of the Doji is very important because ultimately candlestick patterns work as a direct result of trader actions and the sentiment of the market. When the market is consolidating,if you see a Doji candle, it will signify uncertainty prior to a breakout.
For instance, if EUR/USD is advancing strongly for a few days, the emergence of a gravestone Doji at a critical resistance point indicates that the bulls tried to advance the price upwards, yet could not manage to hold the ground as the candle expired.
Professional traders who operate in institutions or in Forex frequently monitor the occurrence of Doji candles close to critical technical points as this might signal an underlying weakness or strength.
Logarithmic vs Linear Charts: What’s the Difference in Trading Analysis?
How Is Doji Candlestick Pattern Formed?
The action often kicks off with either buyers pushing prices skyward or sellers dragging them down hard. But somewhere along the way, opposite forces step in and cancel out the earlier push.
By trade’s end, the open and close are almost identical, leaving behind a tiny body with long shadows, or none at all. The process of Doji formation can provide traders with insights into the underlying order flow driving the formation of the pattern instead of just considering it as a graphical phenomenon.
Doji Pattern in Foreign Exchange Trading
The Doji is a popular candle pattern among Forex traders for several reasons. Traders will rely heavily on Doji candle formations for the following currency pairs:
- EUR/USD
- GBP/USD
- USD/JPY
It is important that Forex traders choose brokers who offer fast execution and tight spreads when trading candlestick patterns in volatile markets. Choosing the right trading environment and comparing different trading account types can significantly affect execution quality and trading costs. Doji candles are particularly effective during these timeframes:
- London session
- New York session
- Major economic news releases
Doji Candlestick Structure
The main difference between a Doji candle and all other types is the opening and closing prices are almost equal. A regular Doji candle has:
- Opening Price
- Closing Price
- High Price
- Low Price
The wicks indicate the range in price for that time period:
- Upper Wick = Indicates that buyers drove the price up.
- Lower Wick = Indicates that sellers drove the price down.
- The wicks reflect the price range reached during the session and show where buyers or sellers temporarily gained control before price returned near the opening level.
Different Types of Doji Candlestick Patterns
Despite the fact that all Doji candlestick formations imply indecision in the market, not all of them have the same significance for the traders. The construction of the candle, its length, shadows, and positioning can drastically shift the meaning of the candle and make the trader look at it from another perspective.
While some Doji patterns may indicate a probable bullish reversal, there are also patterns that point to bearish exhaustion, continuation of the trend, or increased volatility on the Forex charts. Studying the various types of Doji candlesticks is important since it allows traders to get a better understanding of the market psychology of buying and selling. Let us take a closer look at the most important Doji patterns.
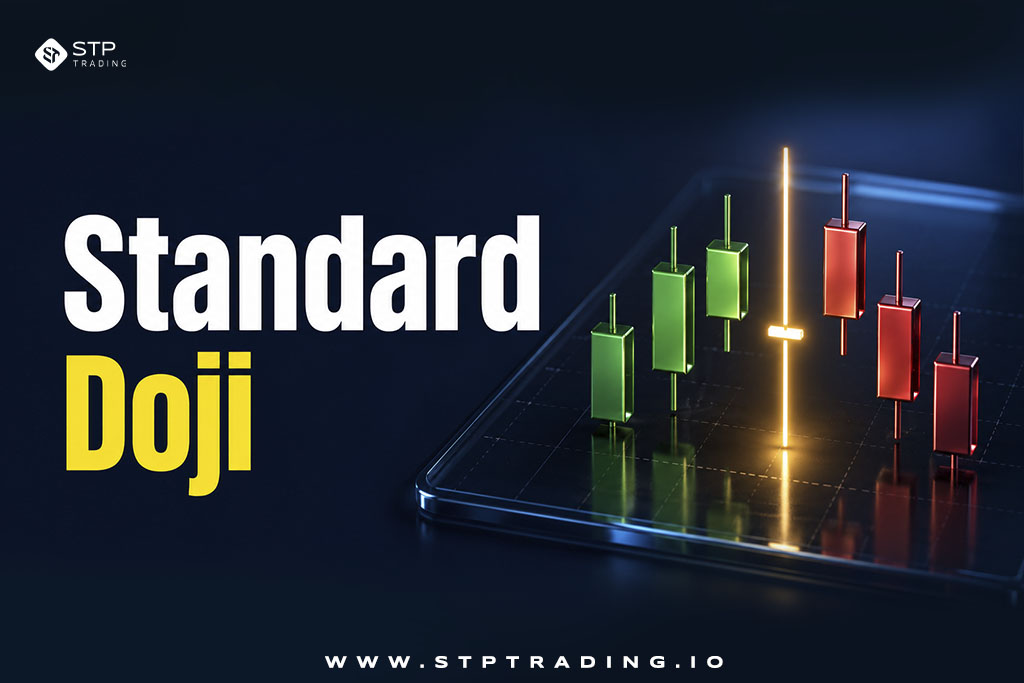
Standard Doji
A standard Doji typically has balanced upper and lower wicks with a very small body positioned near the center of the candle. Indicates a balance in the market, a period of time when the market is neutral, and a market that is likely to change direction or show a sign of continued instability. The standard Doji is the most frequently found candle in the Forex market.
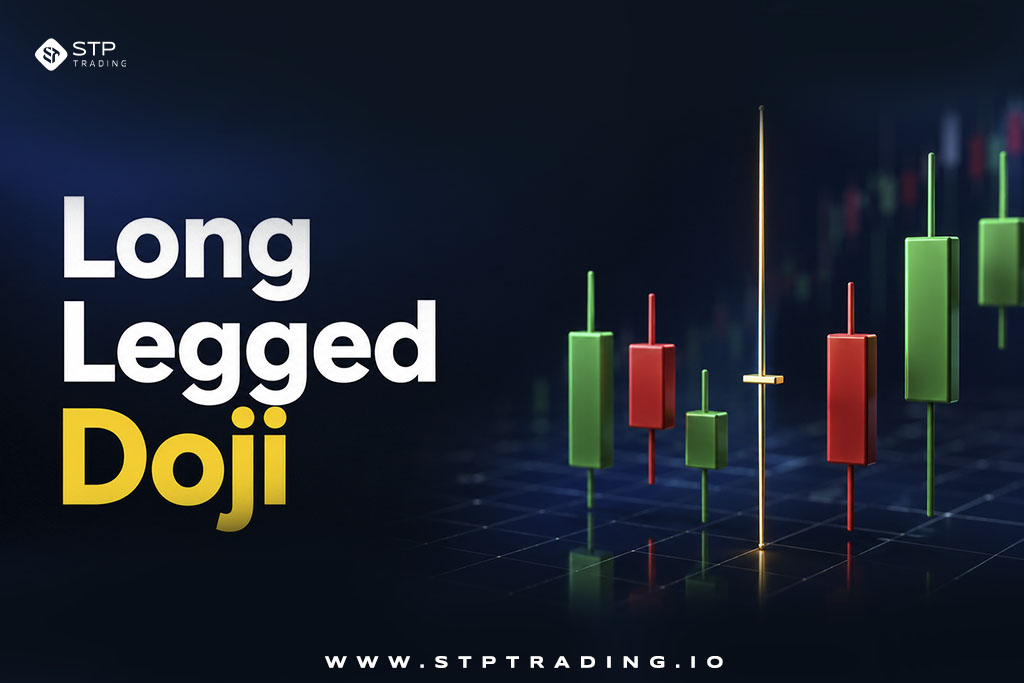
Long Legged Doji
The long legged Doji is often present at times when large breakouts or significant changes in momentum take place.
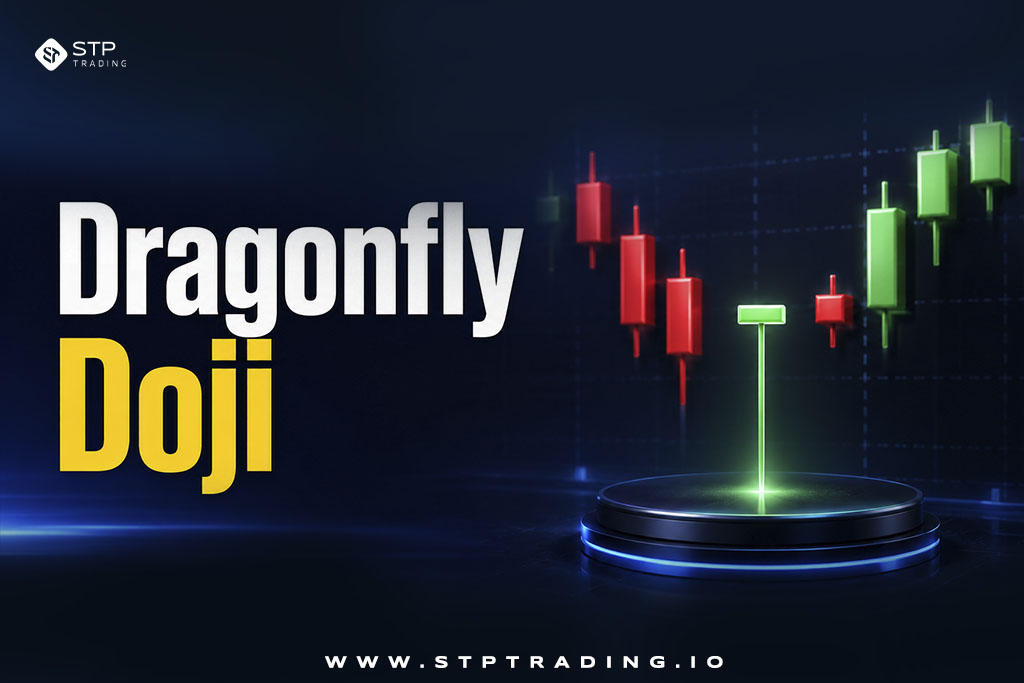
Dragonfly Doji
A dragonfly Doji consists of:
- A long lower shadow
- Almost nonexistent upper wick
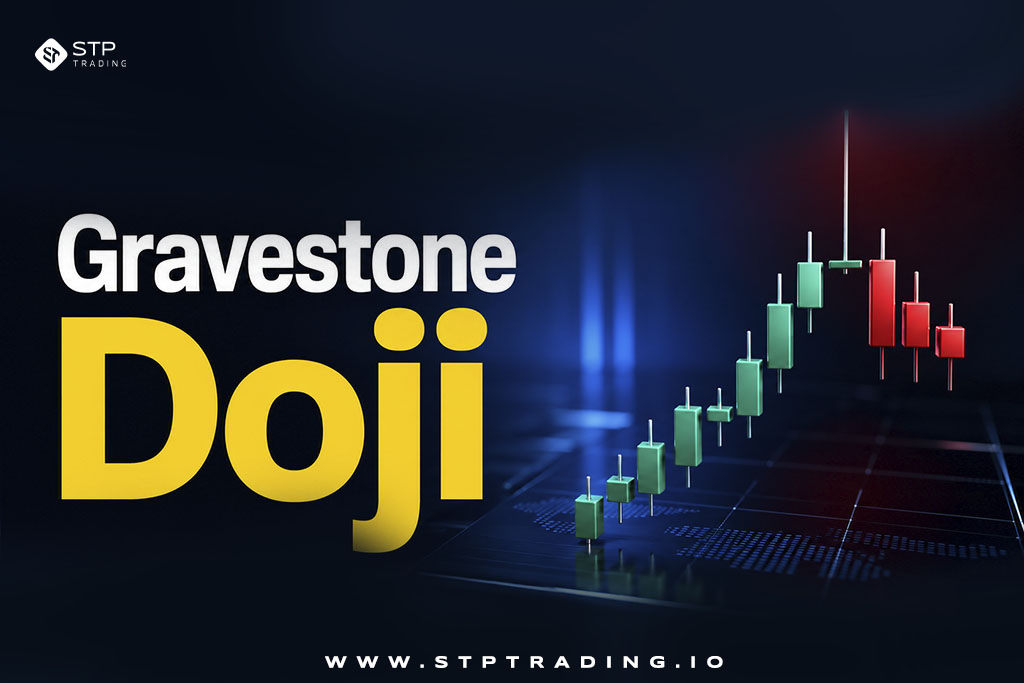
Gravestone Doji
The appearance of a gravestone Doji indicates buyers pushed the market higher but were unable to hold on to gains by closing in the lower half of the candlestick, subsequently indicating a potential bearish reversal following an uptrend. A gravestone Doji consists of:
- A long upper shadow
- Almost nonexistent lower wick
- The close is within the lower portion of the candle
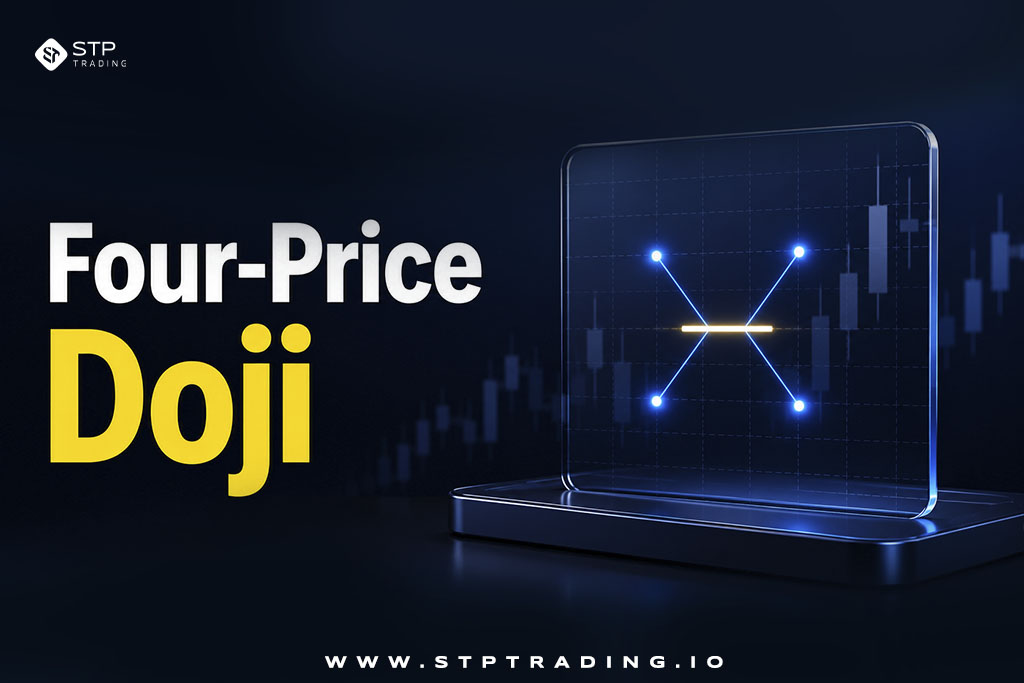
Four-Price Doji
A Four-Price Doji is a rare occurrence when opening, high, low and closing all occur at or very near the same price. Four-Price Dojis are typically not instrumental in making day trading decisions. The Four-Price Doji typically demonstrates:
- Extremely low volatility
- A lack of liquidity
- A lack of market activity
Identifying a Doji Candle Pattern Accurately
A lot of novice traders confuse a Doji pattern with a regular candlestick. A Doji pattern should occur after a trend has emerged or near price key levels. Advanced technical traders often use Doji candles in combination with other Forex indicators such as RSI & MACD to identify strong Doji setups. To identify a valid Doji pattern use these criteria:
- The open and close prices should be almost the same
- The length of the candlestick body should be tiny
- The context of the Doji pattern must be significant in the market
Doji Candlestick Pattern Scanner
One can automatically scan for Doji candlestick patterns with modern trading platforms, by using scanners, screeners, and algorithmic indicators. These are extremely useful for traders who need to find the potential setups among a wide range of currency pairs and timeframes all at once. Most sophisticated scanners can even let traders define custom filters such as:
- Direction of the trend
- RSI parameters
- Volume checks
- Choosing timeframes
- Volatility thresholds
Popular platforms offering Doji scanning tools include:
- MetaTrader 4 (MT4)
- MetaTrader 5 (MT5)
- TradingView
- cTrader
Automation is helpful in recognizing trading patterns if one deals with several currency pairs at the same time. You also can check the manual trading vs automated trading for more information. A trader can set the scanner to find only the following:
- Bullish dragonfly Doji candlesticks
- On 4-hour timeframes
- When the RSI is oversold
- During busy hours in London and New York sessions
When Doji Patterns Often Occur?
Doji candlestick patterns often occur near:
- Significant S&R lines
- Trend Lines
- Fibonacci Retracement levels
- Supply or Demand Areas
- Psychological Levels
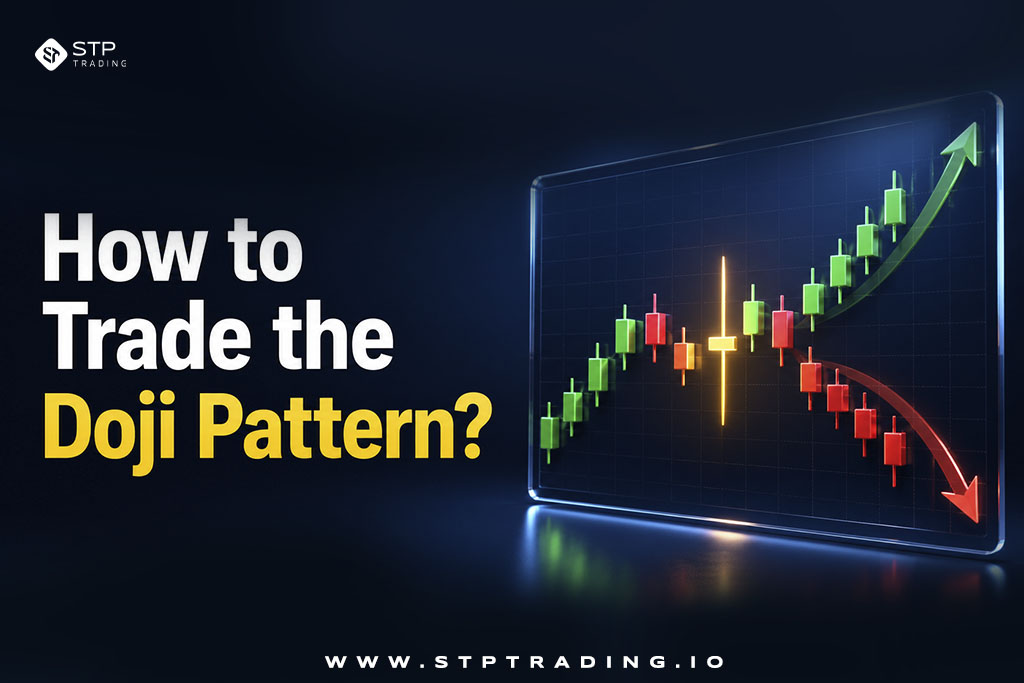
How to Trade the Doji Pattern?
When it comes to Doji trading, it goes beyond merely recognizing a candle with a tiny body on a chart. The success of Doji trades is based on the proper recognition of the market situation, detection of the trend direction, and waiting until certain signals come up to initiate trades.
Given that Dojis reveal market indecision, traders see them as signs of a possible momentum reversal, not the triggers for trading action. When trading with Dojis, it would be wise to use this candlestick formation on the critical levels of supply and demand, trend lines, Fibonacci extensions, and other zones with several other factors at work. We will elaborate on this in the next sections.
Wait For Confirmation
One common mistake that traders make when trading Doji is entering their positions immediately when the Doji appears. Doji candlestick patterns only indicate indecisiveness by market participants.
Candle patterns cannot be relied upon alone when looking for an entry point; confirmation is absolutely necessary. If no confirmation takes place, false signals will be more prevalent. For example:
- Confirmation of a Bullish Doji = a strong Bullish candle appears after
- Confirmation of a Bearish Doji = a strong Bearish candle appears after
Trade Doji Patterns Near Key S&R Levels
The position of the Doji pattern within the chart should be given more relevance than the pattern itself. This is why professional traders will look at the larger picture rather than only considering the shape of the Doji. If a Doji appears:
- At Resistance after an uptrend then a potential reversal may occur
- At Support during a downtrend then buying pressure may exist
Combine Trend Analysis With a Doji Candlestick Chart
Trading against a clear trend can be very dangerous. By identifying the trend structure along with Doji analysis you can significantly increase your chances.
- Use (Reversal Doji) only with solid confirmation
- Use a Doji (Bullish Doji) in an upward trend.
- Use (Bearish Doji) in a downward trend.
Technical Analysis of a Doji Candlestick Pattern
Most of the time, professional traders do not consider the Doji candle in isolation but in the context of technical structure of the market that can show whether there is any value in the signal at all.
The position of the Doji on the chart is one of the most important aspects when conducting analysis. Randomly appearing Doji in consolidation zones where there is low trading activity will mean nothing, but in major breakout areas and institutional price levels, the pattern can take some importance.
For instance, when a Doji appears near the resistance level after the price has moved higher for some time, it might be a sign that bullish momentum was absorbed. On the other hand, when a Doji appears after a strong decline towards historical demand levels, it may mean that selling pressure started
Candle compression is another major idea. Several small bodied candles with Doji in between are providing the setting for momentum and as such their estimation is very important.
If the technical context around the Doji is extensive, the message conveyed by the Doji is more reliable.
Use of Doji with Technical Indicators
Many traders combine Doji signals with real-time Forex analysis and technical indicators to improve confirmation quality and identify higher probability setups.
Doji + RSI
The bullish Doji plus an oversold RSI can provide even more confirmation for a bullish reversal. The bearish Doji plus an overbought RSI can show bullish weakening. In an uptrend, a bullish Doji with the RSI under 30 may hint at exhaustion in selling pressure.
During a downtrend, a bearish Doji with the RSI over 70 could indicate weakening buying power. Many other traders look for RSI to quickly escape overbought or oversold areas after the formation of the Doji.
Doji + MACD
MACD crossovers can provide confirmation of momentum shift after the price breaks after the Doji formation. The MACD tool provides valuable information for determining momentum and trends changes that happen after a Doji is formed.
Due to the fact that the Doji candlestick pattern indicates the period of indecision, a trader can get confirmation of continuation or reversal depending on MACD. In general, traders usually pay attention to the following conditions:
- Crossing of the MACD line above the signal line after the bullish Doji
- Crossing of the MACD line below the signal line after the bearish Doji
- Momentum of the histogram before the reversal
Doji + Moving Average
A Doji candle around a key moving average level will become even more significant. Traders also consider the angle at which the moving average is going up or down. The formation of a Doji on the rising EMA line is more likely to lead to further trend continuation than the flattening moving average.
In trending conditions, using the moving averages, traders try to distinguish between a random Doji and a good setup for trading. Some popular ones include:
- 50 EMA
- 100 EMA
- 200 EMA
Doji + Fibonacci Retracement
Doji candles in conjunction with Fibonacci levels can help traders pinpoint reversal zones with high probabilities. Fibonacci retracement levels are often used as the level of possible correction, reversal, or continuation of the current price direction.
When Doji occurs near an important Fibonacci retracement level, traders usually interpret it as a reaction to the technical level. The most common retracement levels are:
- 38.2%
- 50%
- 61.8%
For example:
- Bullish Doji near the 61.8% retracement level during an uptrend may mean that buyers attempt to resume the uptrend.
- Bearish Doji near the 50% retracement level after a bullish movement may mean that there is additional resistance
Best Timeframes for Trading Doji Candles
Doji candles may occur in any timeframe; however the level of reliability will differ. Because of the below chart, most professional traders will only rely on Doji candle patterns in higher timeframes.
| Timeframe | Duration | Pros | Cons |
|---|---|---|---|
| For lower timeframes | 1 minute, 5 minutes, 15 minutes | More tradable opportunities | More noise, More false signals |
| For higher timeframes | 4 hour, Daily, Weekly | Greater reliability, Greater clarity of the trend, More apparent level of institutional involvement | – |
Double and Triple Doji Trend Continuation Method
Many traders generally link the Doji candle to market reversals but if the Doji candles are formed in numbers, it is a different matter. Actually, multiple Doji candles might indicate that the trend will continue rather than be exhausted.
Double Doji is the variant when 2 Doji candles are holding positions one after the other, while a Triple Doji means three almost indistinguishable indecision candles. The most common indications of the above mentioned figures are:
- Temporary decline in volatility
- Market compression
- Order absorption on the part of institutions
- A break before a continuation
Bullish Doji Strategy
You will normally find a Bullish Doji setup after a down trend. You will enter after the Bullish confirmation candle has been closed. Using the Bullish strategy to trade the oversold RSI works exceptionally well.
- Entry Conditions: You will enter after the Bullish confirmation candle has been closed.
- A down trend is present
- Put it below the Doji low
- A Doji has formed at the support level
- A Bullish confirmation candle has formed
- You will exit your trade using: previous resistance levels, risk and reward and trailing stops
Bearish Doji Strategy
You will usually find a Bearish Doji set up after an upward trend. During volatile reversal conditions, some traders use hedging in negative margin techniques to temporarily reduce exposure while waiting for market confirmation.
- Entry Conditions: You will enter after the Bearish confirmation candle has closed.
- An upward trend is present
- Put it above the Doji high.
- A Doji has formed at the resistance level
- A Bearish confirmation candle has formed
- You will exit your trade using nearby support zones, risk or reward and continuation of trend targeting
Doji Star Patterns
Doji star formations refer to advanced candlesticks formations where indecisive Dojis are combined with larger candles to develop highly accurate reversal setups. They are popular trading tools used extensively in forex, stocks, and commodities markets as they indicate a clear change in market sentiment. The two main types include:
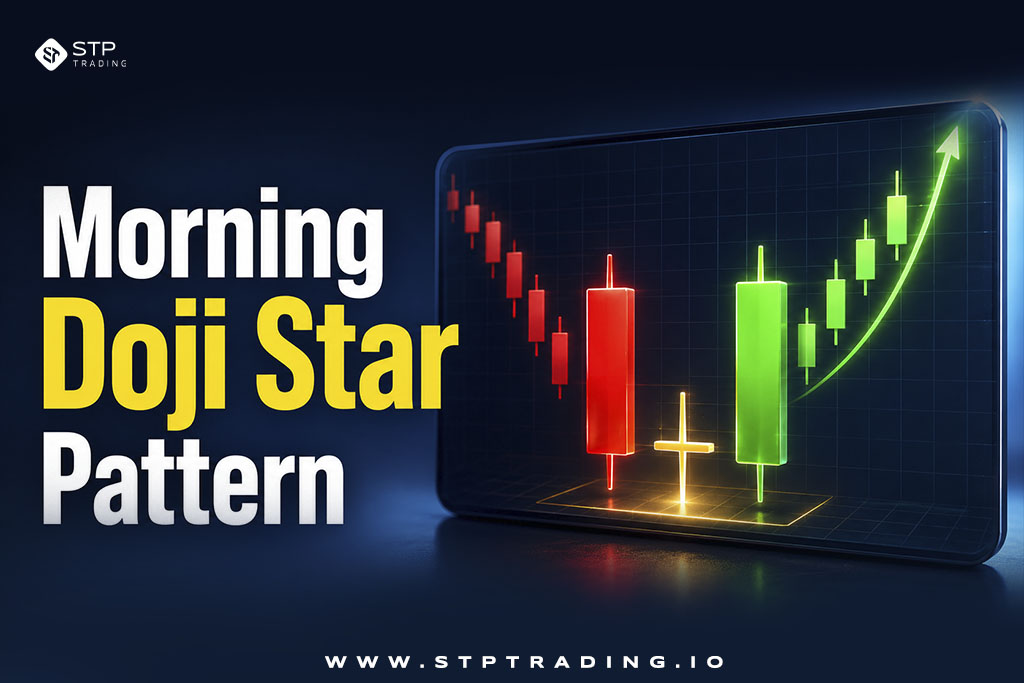
Morning Doji Star Pattern
The Morning Doji Star is a bullish reversal pattern which occurs mostly after a downtrend. It implies that bearish sentiment is losing its momentum while buyers start moving into the market. The pattern includes:
- Large bearish candle
- Doji candle (reflecting indecision)
- Large bullish candle (confirming reversal)
The most potent setups for this pattern occur:
- Near major support levels
- During oversold conditions
- Overbought areas
- Long-term demand areas
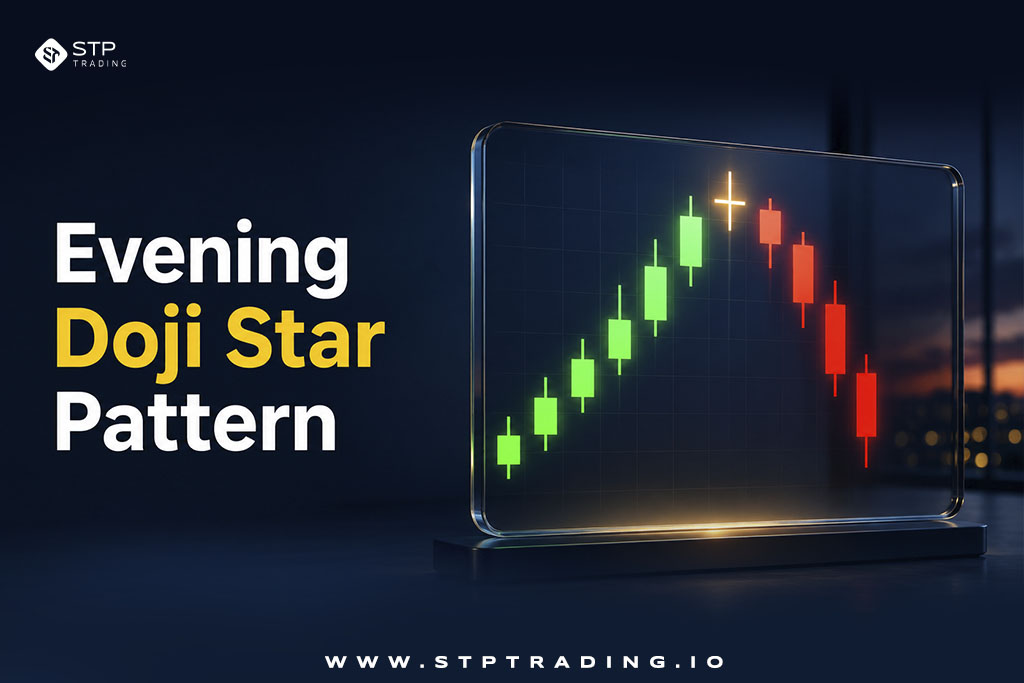
Evening Doji Star Pattern
An Evening Doji Star is a bearish version, which normally occurs after the end of an uptrend. It shows fading bullish domination along with growing bearish selling pressure. Traders view Doji Stars as more accurate patterns than individual Doji candles due to surrounding candles indicating changing market situations. Such a formation involves:
- A strong bullish candle
- A central Doji candle
- A strong bearish confirmation candle
Is the Doji Candlestick Pattern Reliable?
Dojis can be very effective under the following conditions:
- Applied to the right scenario
- With additional confirmation
- Technical confluence
- Effective risk management
However, a Doji must never become a trading system in itself. In reality, the Doji’s value lies in comprehending the psychology of market players. Professionals apply Doji patterns in combination with:
- Trends
- Market structure
- Volume
- Economic events ( You can get help from economic calendar to check these events)
- Risk management
Doji Candlestick Pattern Example
Suppose EUR/USD is trending strongly upwards. The price touches an essential resistance level and creates a gravestone Doji formation on the daily time frame. The next candlestick closes bearish. The pattern may signal:
- Buyers’ exhaustion
- Growing selling pressure
- Potential trend reversal
A trader might choose:
- Go short after confirming the pattern
- Put a stop-loss above the high of the Doji
- Target the nearest support level
Doji Candles vs Spinning Top Candles
Even though Doji candles and Spinning Top candles depict market indecision, they are not the same and may imply different trading outcomes. A clear grasp of the distinction between these 2 candlestick formations therefore makes the price action interpretation more precise and helps in steering clear of mixing up market-neutral signals.
| Feature | Doji Candle | Spinning Top Candle |
|---|---|---|
| Body Size | Very small or almost absent | Small and present |
| Open and Close Prices | Same | There is some difference between them |
| Significance of the Market | Great indecision and balance of buyers and sellers | Indecision with some preference |
| Strength of Signal | A strong indication of a trend change or pause | Weak indication of a trend pause |
| Shadow Formation | Can have either a long or a short one | Normally it has an equal upper and lower shadow |
| Application in Trading | Trend reversals, breakouts and trends exhaustion | Trend pauses and consolidations |
| Significance | Important in the presence of key support or resistance levels | It becomes important in the context of trend analysis |
| Variation | Long-Legged, Dragonfly and Gravestone | Spinning Top |
Advantages of Doji Candlestick Patterns Trading Strategy
- Highly Visible Pattern
- Universal Pattern
- It can be used in various markets such as: Forex market, equities market, Cryptocurrencies, Commodities and indices
- Useful for momentum trading
- It helps traders detect momentum shifts.
- Flexibility
- Dojis can be used with scalping, swing trading, day trading, position trading
Disadvantages of the Doji Pattern
- Deceptive Candles: Not all Dojis indicate upcoming price reversal.
- Confirms Other Tools: The pattern by itself is not enough for trading decisions.
- Ineffective During Sideways Movements: When there is low volatility, Dojis cannot be trusted.
- Mistaken for Other Patterns: Beginners mistake regular candles for Doji candles.
Pro Tips for Trading Doji Patterns
- Look for High-Quality Setups
- Avoid trading Dojis formed around resistance or support zones, reversal zones and fibonacci levels
- Use Multiple Time Frames
- Conduct technical analysis in higher time frames and trade on lower time frames.
- Focus more on trade quality than trade quantity
Apply Strict Risk Management Rules
Avoid over leveraging the Doji pattern. Risk management is more important than any pattern. In addition to technical trading skills, traders must consider using a stable trading environment with fast order execution capabilities.
Common Doji Trading Mistakes
Several traders , ignoring the trend, taking entries too early, or simply following the pattern without any other technical confirmation are the ones who incur huge losses.
Misunderstanding Every Doji is a Reversal
It is important not to expect reversals after every Doji appears. Many Doji’s appear during random consolidation phases and don’t have great predictive power.
Missing the Market Context
A Doji in the middle of a range is a lot weaker than one at a strong support or resistance level. Context is always more important than just plain pattern recognition.
Entering Your Position without Confirmation
A confirmation candle will show that you are much less likely to enter on a false entry. Professional traders do not enter into a position until they confirm with evidence.
Using Tight Stop Loss
The Forex market can be very volatile. Having your stops set too close to your Doji may cause premature exits and increase account pressure during unstable market conditions. Many traders also use anti-margin call protection strategies to better manage high-risk situations.
Not Practicing Risk Management
No candlestick pattern is guaranteed to work 100% of the time. Risk management is fundamental to long-term trading success. The average trader will only risk 1% to 2% of their account balance on a trade.
Learning to Trade the Doji Pattern in Forex Market
Learning how to trade the Doji candlestick pattern is extremely important as it can help traders understand a situation that interests everyone, the possibility of changes occurring in the market.
Trading any type of instrument, from stocks and commodities to indices and Forex, knowing how to interpret Doji candlesticks will be useful and beneficial to you. However, trading with the Doji pattern should be done with other signals and risk management principles to ensure successful results.
Whether you trade Doji reversals on EUR/USD or build advanced price action strategies, STP Trading provides the fast execution, tight spreads, and professional trading environment needed for precision candlestick trading.
FAQs about the Doji Candlestick Pattern
Is Doji Bullish or Bearish Candlestick Pattern?
The Doji candlestick pattern is neutral itself. What it means depends on its appearance and market situation.
Which Doji Pattern Is Most Powerful?
Dragonfly Doji and Gravestone Doji are often considered the strongest ones.
Can beginners trade based on the Doji candlestick?
Yes, beginners can trade using Doji candlesticks because they are easier to detect. Nonetheless, traders need to learn how to confirm the signals along with how to manage risks.
Is the Doji strategy effective in Forex?
Yes, it is highly effective since currency pairs often experience changes in trends and volatility.
Which timeframes are better for Doji trading?
High time frames like the four-hour and daily charts provide more accurate Doji signals compared to lower timeframes.
Should I enter a trade based on Doji signals without confirming?
No. Trading without confirmation can result in many mistakes since there are too many fake signals.
Is the Doji signal sufficient for a strategy?
No, it is not enough for an entire strategy.


 Telegram Support
 WhatsApp Support
 Live Chat