As a new forex trader with just a few months of experience, you’ve likely started to notice a profound truth: price action isn’t random. It moves with rhythm, structure, and purpose. But what is the language that reveals this deeper order in the chaos of the markets? The answer lies in trendlines in Forex. one of the most powerful and foundational tools in technical analysis.
These lines are a route over hills and valleys of price action, like a road which winds its way along a series of mountains. Used correctly, trendlines can allow you to predict turning points, pick out trades, and avoid emotional trading.
They make sense of uncertainty, especially when combined with other techniques for trading. In this guide, we’ll explore what trendlines are, how they function in forex trading, and why every trader, especially those just starting out, should learn to use them effectively.
What Are Fibonacci Retracement Levels?
What Is Trendline in Forex Strategy?
In trading strategy, what exactly is the trendline in forex? Forex trendlines aren’t lines on the chart. They are the narratives of price. These lines tell you where the market has been, where it is headed, and how in-the-money traders are acting at the moment.
When you step back and draw a smooth, upwards line that touches numerous swing lows, it’s not ruler or perfection—it’s mapping the heartbeat of the market. It is the use of trendlines to find entry points, stop loss locations and Take profit.
Profit will come whenever price gets near the other end of the channel or shows reversal. If you are a starter, there’s an excellent tutorial on How to trade trend lines in forex for beginners.
Trendline meaning in forex is heavily associated with price psychology. When the international market sees price reacting at a level time and again, the level gains psychological significance.

This is where trendlines become powerful predictive tools. You can combine trendlines with other Forex technical analysis to extend the trade timing and profit volume. In the first step, you need to know what is Forex technical analysis?
What Is a Trendline in a Graph?
One of the simplest and most graphically pleasing technical analysis tools used in forex trading are trendlines. These lines connect 2 or more price points and increase the power of support and resistance.
You can differentiate the direction of the Forex market based on the graphs and consider the market trend like bullish, bearish and sideways. To find out more about how forex traders use trends, let us first learn what is a trend line in a graph in general.
A trendline in technical charts is merely a line that goes across pivot highs or beneath pivot lows to indicate the direction in which prices are moving.
An upward trendline or positive trend line joins rising lows. A downward trendline or negative trend line joins falling highs. These lines graphically simplify the complex price movement of currency pairs, thus making it easier to identify trading opportunities.
Dead Cat Bounce in Forex Strategy
Types of Trend Lines in Forex
How do you identify a trend line? There are essentially 2 types of trendlines in Forex based on the direction of the market:
- Positive Trend Line (Uptrend): It is plotted below the price and connects higher lows. It indicates the price making new highs again and again, and the buyers are in control.
- Negative Trend Line (Downtrend): It connects lower highs and is plotted above the price. It indicates a bearish market with the sellers in control.
Knowing when to use each trendline is critical in putting strategy into effect and also can be incorporated into broader market paradigms, as discussed in Top Trading Strategies in the Forex Market. You can check the below chart for more information:
| Type of Trendline | Position on Chart | Connects | Market Direction | Interpretation |
|---|---|---|---|---|
| Positive Trend Line | Below the price | Higher lows | Uptrend or Bullish | Buyers are in control and price is consistently making new highs |
| Negative Trend Line | Above the price | Lower highs | Downtrend or Bearish | Sellers are in control and price is making lower highs |
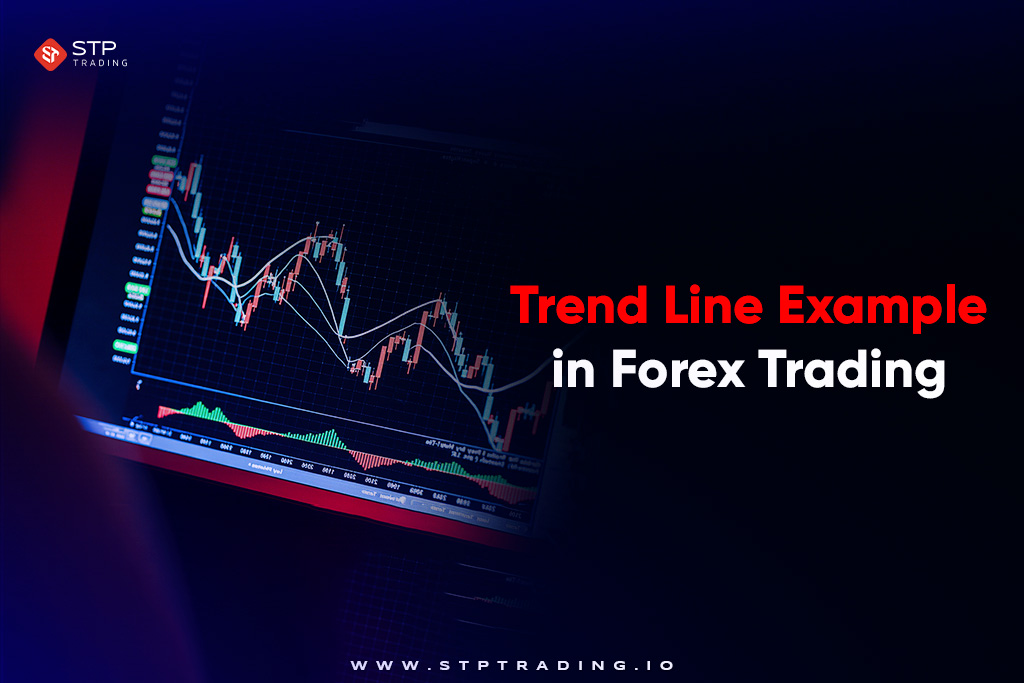
Trend Line Example in Forex Trading
To observe how a trendline performs in real market conditions, use the currency pair EUR/USD on the daily chart—one of the most popular charts used by swing traders due to its balance between near-term accuracy and big-picture perspective.
Assume EUR/USD has been in a many-weeks-long uptrend for the last few weeks. A trader begins to notice the trend by marking 2 significant higher lows, each after minor retracements of successive price rises.
These swing lows are interim support points in the overall uptrend. The trader draws a diagonal line of support connecting these 2 lows, sloping upward. The trendline is not yet definite at this stage—it charts a probable direction but is not yet confirmed.
A couple of sessions later, price retraced again and kissed the trendline for the third time, then bounces back up sharply, making yet another higher low. What confirms a trendline?
This third reaction point is a confirmation point, confirming that the trendline is being respected by the market participants. It now becomes a dynamic support level.
Traders watching this setup could take it as a buy signal to initiate a long position at the third touch, anticipating the trend to resume.
In order to increase the trade’s accuracy, a trader might employ this trendline analysis together with other tools—such as an RSI indicator that is in bullish divergence along the trendline, or volume analysis showing more buying pressure at the point of contact.
Using Dow Theory for Effective Forex Trading Strategies
Key Features of a Trendline for the Best Market Prediction
Understanding the essential properties makes trendlines in Forex most useful. Here are the essential features to know:
- Direction
- Slop
- Touch points
- Time frame
Note that Trend Lines on higher time frames are more reliable in general. Need more robust insights? Visit our Free Forex Signals page and trade with accuracy. We are going to explain the most important features in the following parts.
Relative to Price
The direction of this line will tell you what to do. Trendlines in Forex also help you decide entry plans or exit points. You can buy near the bullish or uptrend line and sell near the bearish or down trendline.
Line Clarity and Cleanliness
The perfect trendline will connect clear swing points—neither forced through wicks of candles nor zigzag highs/lows. A “clean” trendline provides a psychological point of reference for traders who are watching the same levels.
If you have to force a trendline through noisy data just to get it to fit your bias, it is less trustworthy. The best trendlines are those that appear self-evident to the majority of traders.
This is because forex markets are mass psychology. The more traders who “see” the trendline, the likelier it will be to influence price action.
Connection with Volume and Indicators
While a trendline is a price indicator, its complementarity with volume or technical indicators converts it into a still more potent predictor. For instance, a bounce from a trendline with rising volume shows strong conviction in the move.
Similarly, evidence from RSI divergence or MACD crossovers near a trendline adds another layer of assurance. This intersection of indicators creates what traders call confluence zones—areas where multiple signals overlap—leading to more-probability trades and improved forecasts.
Trend Line Break and Retest Pattern
One of the most important things to watch is how price behaves after a trendline breakdown. When price breaks a trendline and subsequently tests it from the opposite side, this generally serves to validate a change in the trend’s direction.
This behavior is especially useful for reversal or breakout traders looking to establish new positions as the market changes. Break and retest patterns can be employed as trade entries of strategy, especially when supported by chart patterns like head and shoulders, double tops/bottoms, or wedges.
Convergence with Market Structure
The best trends are those that coincide with bigger picture market structure—major support/resistance levels, round numbers, or previous highs and lows. When a trendline breaks through these regions, it is much more powerful.
This characteristic allows traders to combine trendline analysis with different concepts to build both entry conviction and timing.

Psychological Impact on Traders
And finally, trendlines affect behavior on an emotional basis for traders. When price is near a familiar trendline, most traders will react—some by taking the trade, some by closing or repositioning risk.
This self-fulfilling effect makes trendlines affect price action rather than simply indicate it. Understanding the emotional importance of trendlines will allow you to prepare and avoid being ambushed, especially at the time of major news releases or very volatile sessions.
How to Draw a Perfect Trendline?
Drawing a trendline is art and science. These are the steps:
- Find Swing Points: Identify 2 or more consecutive higher lows in an uptrend or lower highs in a downtrend.
- Connect Points: Connect these swing points by drawing a straight line.
- Project the Line: Project the line into the future.
This projection is your potential support/resistance area. The key is precision and patience. A perfect trendline intercepts at least 2, preferably 3, high-quality points. Isn’t coerced—don’t force a trendline to suit your view.
Is it best drawn on higher time frames such as 4H or daily for greater reliability? Need a snapshot? Use Trendline charts in TradingView to master line drawing and verification.
For automated support, use the best auto trendline indicator TradingView, which makes it easy for new investors to quickly identify important areas.
How to Use Trendlines Effectively in Forex Trading?
Check the below options to get the answer for the question: How to Use Trendline in Practice?
- Trend Confirmation: When price touches the trendline numerous times and doesn’t break, the trend is strong.
- Breakout Signals: A tidy break of a trendline may signal a reversal or weakening of the trend.
- Confluence Zones: Mix trendlines with moving averages, Fibonacci levels, or support/resistance for high-probability trading setups.
- Keep in mind: the greater number of times a trendline being tested and holding, the stronger.
- Volume Confirmation: Institutional presence may be indicated by volume spikes when testing trendlines.
- Plot Your Trendline: Use important swing points.
- Wait for Touches: Let price touch the trendline several times.
- Confirm using Candles: Look for reversal or continuation patterns.
- Execute Your Trade: Execute your trade with stop-loss and take-profit targets in terms of market structure.

Beginners can also enjoy Best Market to Trade for Beginners to see how to utilize the appropriate instruments to apply these methods.
Successful trendline trading is more than line drawing. Find out more in Principles of Professional Trading in the Forex Market.
How to Calculate Trendline?
In trading when done professionally, trendlines are mathematically computed using linear regression formulas. For manual trading, drawing lines between the highs or lows is the rule as a requirement.
If you want to add trendline logic to an automated system, try adding it together with the Types of Trading Accounts we offer for algo or EA trading strategies.
That is, statistical methods that determine the line of best fit between a series of price points so that the difference between the data points and the line of best fit is minimized.
The least squares method is the most common method that estimates the trendline based on the following linear equation:
Y = aX + b
Where:
- Y is the price that has been predicted
- X is the time (or period) that has been forecast
- a is the slope of the trendline (rate of change in price)
- b is the Y-intercept (starting value on the price axis).
This linear regression trendline provides the trader with a mathematically objective view of market trend and is especially of use in computerized or high-frequency trading systems where precision is all-important.
For hand trading, however, standard procedure is to plot trend lines by connecting swing highs or swing lows—placing them aesthetically on top of significant turning points on the chart.
As subjective as this step is, it is also more sensitive to the psychology of the market, because it depicts price action that many are following in real time.
The True Significance of a Trendline in Forex Analysis
Why are trendlines significant? They have Graphic Clarity option and de-clutter the chart. Also, their Strategic Insight Helps with entries, exits, and stop-losses. Another thing about trendline in Forex is its Psychological Zones Markers of where crowd behavior can repeat.
Moreover, the forecasting option offers insight into probable future price action. As background, read What is the Future of Forex Trading for more information about anticipating by trendlines.
What Are the 3 Touches on a Trendline?
What are the rules for trendline? Three touches close to a trendline is a simple rule of technical analysis. It refers to the idea that a trendline will not be valid until the price has touched it at least 3 separate times without breaking through.
The three touches serve as verification that the trendline is respected by the market and is not a random line. This rule is especially crucial in the case of forex trading, where market noise and spurious signals may easily mislead the trader.
The “three-touch rule” eliminates random associations and avoids the trendline from being visually correct but lacking authentic market response and psychological participation on the part of sellers or buyers.

This is a key rule. A suitable trendline should preferably:
- Touch price at least 3 times
- Be well-spaced on the chart
- Not cut through candle bodies unnecessarily
Three touches verify the strength and credibility of the line. We will explain more in the following parts.
First Touch: Determining the Trend’s Possible Course
The first touch establishes the potential beginning of a trend. For example, if you’re observing a currency pair breaking down to a new low and then higher low, you can draw an initial trendline between the two.
Now, however, the trendline is not confirmed—it’s merely a projection or a potential point of support or resistance. At this point, the trader should monitor the market but refrain from trading based on two points.
It is a situation of drawing the outline of a road before understanding where the road goes. While the line may be stunning, it lacks a background history to make it practical.

Second Touch: Drawing the Line with Intent
The second touch allows the trader to extend the actual trendline and start basing it off. With 2 clear pivot points established—either swing lows during an uptrend or swing highs during a downtrend—you can keep drawing out the line forward in order to see how price reacts to it with the flow of time.
This is where most traders will begin to notice the trendline emerge, especially if the points are distinct and visible. Even then, it still has not been confirmed without the third touch.
Traders will utilize it for initial observation but will typically wait until the third contact before they use it for trading purposes.
Third Touch: Confirming Market Respect and Trend Legitimacy
This is where trendline-based approaches can be used. In case a bullish trendline is confirmed with a third bounce, a trader can place a buy close to the trendline, set a stop-loss below it, and aim for a level near the next resistance.
The third touch is also good information for gauging the size of the momentum and the breakout potential.
Trendline Patterns
Trendline patterns are those in which price repeatedly reacts to a trendline, giving rise to patterns such as:
- Trendline breaks
- Trendline channels
- Wedges and triangles
These patterns make good trade setups when accompanied by good risk management.
Trend Line Break
Price closes decisively above or below the line in a trend line break. This can signal a trend reversal and offer breakout trades. It also confirms market exhaustion. So, you can use confirmation indicators like MACD or RSI to acknowledge the break, or check the Forex Economic Calendar for any relevant news catalysts.
How to Use the Forex Factory Economic Calendar for Forex Trading?
Trendline Channels
Trendline channels are a basic version of these lines when price includes both upper and lower conditions. It means that prices are heading in the same direction. There is also a horizontal or sideways channel, where the trendlines slope fairly flat, revealing a ranging market.
Triangle Pattern
In every triangle pattern, volume will contract as the pattern develops, reflecting diminishing participation. There are 3 triangle patterns in the trendlines of the Forex market:
- Ascending Triangle: The upper trendline is flat and the lower trendline slopes upward. This is a continuation of the bullish pattern where the breaking above the flat resistance initiates more rising action.
- Descending Triangle: The lower trendline is flat and the upper one declines. This is generally a bearish continuation pattern, and the breaking below the flat support indicates further declining action.
- Symmetrical Triangle: Both triangles come with equal angles. It is a neutral pattern.
Wedges Pattern
Wedges are converging trend pattern formations that signal potential market consolidation after which a breakout will occur. They are formed when the price range between two sloping or horizontal trend lines contracts, and there develops a triangular formation on the chart.
These patterns tend to lead to explosive price action and therefore are closely watched by technical analysts. Wedges are mostly categorized under 2 patterns:
- Rising Wedge: Both the support and resistance lines slope upward but with the support line being steeper. This pattern is usually in an uptrend and can be a sign of a potential bearish reversal, especially when seen after a prolonged rally. A breakdown below the lower trendline is a favorite short position trigger.
- Falling Wedge: Both trend lines slope down, but the resistance is sharper than the support. It is generally a bullish formation that indicates a breakout higher. It often forms after a drop or in consolidation and is confirmed when the price crosses above the higher trendline.
Trendlines in Forex vs Channels
Check out the chart to realize the big differences between trendlines in Forex and channels:
| Feature | Trendlines | Channels |
|---|---|---|
| Definition | A single line connecting swing highs or swing lows | 2 parallel lines, one for support and one for resistance |
| Structure | Unidirectional (both support and resistance) | Bidirectional (upper and lower boundaries) |
| Function | Identifies trend direction and dynamic support/resistance | Identifies trend and trading range |
| Visual simplicity | Simple to draw and interpret | Slightly more complex but more informative |
| Trading use | Used to spot breakouts or trend continuation | Used to trade within the range (buy low and sell high) |
| Application | Effective for breakout/reversal strategies | Suitable for range-bound and trend-following strategies |
| Psychological impact | Reflects a key level many traders watch | Reinforces structure by showing balance between buyers and sellers |
| Breakout signals | One line is broken to confirm a shift | Break of either boundary can indicate continuation or reversal |
How to Use a Trendline Indicator in Forex Trading?
For the automated trader, a trendline indicator is helpful in selecting and drawing lines based on algorithmic grounds. This can be a good learning tool but always cross-verify manually.
A trendline indicator is a computerized technical tool that plots trendlines on a chart for the trader to notice market direction, potential entry points, and significant support and resistance levels.
In contrast to manually drawn trendlines whose determination relies on the judgment of a trader’s eyes and discretion, an indicator uses pre-defined algorithms to identify and plot trend lines based on recent highs and lows, closes, or other measures of price action.
To apply a trendline indicator, you begin with choosing the proper one for your trading terminal, e.g., MetaTrader 4/5, TradingView, or cTrader. Most of them can be adjusted, and you can configure the sensitivity (how fast it reacts to price changes), the amount of points it computes, or the timeframes upon which it computes.
When superimposed on a chart, the trendline indicator makes it easy for traders to identify existing trends and anticipate possible trend breakouts or reversals. Although they remove subjectivity and time needed for freehand drawing, they sometimes lag or redraw lines based on volatile price movement.
For automated charting purposes, use platforms like Investopedia’s Guide to Drawing Trendlines.
Which Trendline Is Best?
The optimal trendline respects a minimum of 3 touches and pins to higher time frames. It is also supported by price action. The best trendline in Forex lines up with your approach.
It’s not perfection—it’s reliability and context. For more details on psychological trading considerations, read Is Forex a Skill or Luck? In applying “What trendline is best?” to forex trading, the answer is not just some predetermined angle or mechanism—it’s about context, clarity, and constancy.
The best trendline is the one that most accurately reflects market action, is in line with your approach, and holds up to repeated testing over time frames. The Best Trendline is one that is respected by the market.
The optimal trendline is not forced, but one that is being drawn through natural swing points—with at least two (better three or more) well-shaped highs or lows. This line should be touched several times without the price breaking it, because this confirms that it’s recognized and known by others in the market.
A three- or more-touch trendline becomes a psychologically significant level, which increases its predictive power.
Manual vs. Automated Trendlines
While there are convenient automatic trendline indicators (like those found on MT4 or TradingView), the most successful trend lines tend to come from manual observation, especially combined with experience and intuition.
Automated lines tend to overestimate short-term volatility for changes in trends, whereas a trader can visually cut noise and trendline-reorient for simplicity. The best trendline is not one that can be defined by a particular formula—it is one that:
- Has been validated with three or more valid touches
- Does persist on a meaningful time frame
- Is not too steep or forced
- Correlates with other technical indicators
- Adjusts to the current market conditions
Limitations and Benefits of Trendlines in Forex
Although trendlines in forex have several benefits, it may come with some issues. We will mention pros and cons of these lines:
| Aspect | Benefits | Limitations |
|---|---|---|
| Trend clarity | Helps clearly market direction | Can be subjective |
| Entry and exit points | Assists in timing entries and exits based on price reactions | May give false signals during volatile or ranging markets |
| Support and resistance | Acts as dynamic support or resistance and improving trade planning | Lines may lose relevance if not updated with new price action |
| Ease of use | Simple to draw manually | Requires practice to draw accurately |
| Predictive power | Offers insights into potential reversal or continuation zones | Loses reliability if price breaks and retests fail to confirm |
| Compatibility | Works well with indicators | May not be effective alone |
| Adaptability | Can be useful in any timeframe and market condition | Steep or overly flat trendlines can mislead about momentum |
Who Can Use Trendlines in Forex?
Trendlines in Forex are one of the most commonly used tools in forex trading, utilized by traders of all skill levels and styles. Their simplicity, together with robust visual data, makes them an indispensable part of technical analysis.
The following are the most significant categories of market participants that rely on trendlines and how they utilize them in their trading strategy:
- Retail Traders: Retail forex traders at all levels of experience—novice and seasoned independents included—most often use trendlines to identify the direction of trends, dynamic support and resistance zones, and price action entries.
- Professional and Institutional Traders: Although institutional players generally trade with advanced quantitative models and in-house algorithms, they still follow major technical levels, most notably key trendlines, especially on higher charts.
- EA (Expert Advisor) and Algorithmic Traders: In algorithmic trading systems and expert advisors, trendline logic is typically integrated into the coding system with automated detection methods.
- Swing and Position Traders: Swing and position traders—those who hold trades of weeks to days—heavily rely on trendlines, particularly those found on the daily and weekly charts.
- Technical Analysts and Educators: Trendlines are also used by forex educators, analysts, and signal providers to communicate ideas.
Clarify Your Trading with Trendlines
Trendlines in Forex are not just visual reminders. They are decision-making tools. Properly employed, they help you to avoid emotional trades, avoid pitfalls, and capitalize on high-probability opportunities.
If you are a seasoned trader or simply a curious entrant to the market, learning about and applying trendlines in Forex will bring a systematic advantage to your trading in an otherwise unstructured market.
But remember, no one tool can do anything on its own. Utilize trendlines in Forex with good fundamentals, good analysis, and self-control. For full strategies, refer to our tutorial on what are the 3 Types of Analysis in Forex or view the latest Forex Market Predictions.
Ready to take your trading to the next level? Sign up and open an account on STP Trading broker today. Experience institutional-grade tools, education, and support to trade trendlines in Forex like a pro.
What Is the Money Flow Index (MFI) and How It Works in Trading?


 Telegram Support
 WhatsApp Support
 Live Chat