
 The financial statements of a company tell you stories that most typical traders do not have the knowledge base to comprehend. Each revenue number, cash flow statement, balance sheet, etc. contains profound information about that company’s strengths and weaknesses and what type of future potential it has. Professional investors do not trust the opinions of other investors, nor are they influenced by media headlines. They trust, and utilize, the data provided in financial statements.
The primary difference between a professional investor and an amateur trader is their ability to interpret what the financial statements are truly saying. Once you can illuminate what a company’s financial reports divulge, you will be able to spot opportunities prior to the marketplace acting on them, you will also avoid costly investments, and you will dramatically increase your chances to be successful as a trader.
In this guide you will learn how professionals assess companies’ finances, what to pay attention to, how to detect financial fraud, and how to join financial analyses with up-to-the-minute market data.
What Are Financial Statements and Why Do Investors Care?
Financial statements are records that summarize the company’s financial results for a given timeframe. Typically published quarterly and annually by publicly traded companies, these documents allow investors to determine if a company is performing well financially, generating profits, operationally sound, or in danger of failing.
Professional investors value financial reports because they provide quantitative data rather than subjective accounts of a company’s success, unlike using social media to see how many “followers” or “likes” the company has through a company’s social media pages.
Financial statements can indicate how a company’s net income is falling, whether the company has a lot of debt, or whether there are going to be cash flow challenges for the company long before these problems become known through news outlets, social media, or word of mouth. There are 3 significant financial statements.
All 3 provide insight into some specific aspects of a company’s actual financial position. The ability to connect these reports together will be one of the most important tools you have as an investor or trader.
- Income statement
- Balance sheet
- Cash flow statement
Beginning Your Financial Analysis Process with Data
Investors are good at making smart investment decisions based on reputable financial data sources. Revenue, expenses, debt, profitability, liquidity, and operational performance are all included in the company’s financial statements.
When investors are able to review financial statements, they have access to information that will allow them to determine how well the company is performing.
If you do not have historical financial information available, an experienced trader cannot make a sound investment. This is why successful investors analyze company reports, earnings releases, cash flow statements, and economic indicators prior to executing a trade.
What Does Financial Statement Analysis Achieve?
The primary purpose of performing an analysis of financial statements is to assess the future potential or the financial health of an organization or business. Investors frequently utilize their financial analysis to determine if the organization is making a profit, is financially sound, is being managed effectively, and has the capability to generate sustainable profitability.
Additionally, through the use of financial statement analysis, traders can find potential “hidden” risks that may not show up in published news articles or remain specifically in a company’s promotional material.
For example, sales growth can be reported to be very strong as a result of a successful marketing campaign, however, if a company has declining cash flows or substantial debt, analysts’ findings will help them uncover these potential issues before they develop into major problems in the equity and trading markets.
Financial statement analysis offers more than merely assessing whether a company is undervalued; it also provides a basis for controlling risks associated with investing, helping to allocate assets among different types of investments and determining how to value one’s investments.
Additionally, financial statement analysis assists investors in comparing various companies against one another objectively without using emotion or speculation.
How Professional Investors Read the Income Statement
The income statement provides an overview of how much cash the company has received and spent in a particular stage of time. This information allows you to determine whether the company is profitable and how well it is performing.
Revenue Growth: The First Sign Investors Look For
Revenue refers to the total income a company generates from selling products or services. Professional Investors examine other information beyond just looking at whether the revenue is growing. Some of these include:
- Revenue growth consistency
- Seasonal changes
- Industry comparisons
- Quality of the growth
An example of this would be that if a company’s revenue is growing at 20% a year, this might seem appealing; however, if its expenses are growing at 35%, then the company could be losing its profit.
Gross Profit Margin, A Secret Measure of the Strength of Your Business
Gross profit margin is the difference between the amount of money a company made off its sales and the cost it incurred to produce those sales. Formula is:
(Gross Profit ÷ Revenue) × 100
An increase in gross profit margin can indicate:
- Strong pricing power
- More efficient operations
- A strong competitive advantage
A decrease in gross profit margin could indicate:
- More competition from other companies
- An increase in the cost to produce products
- A decrease in demand for the product
Professional Investors typically look closely at gross profit margin trends to help them determine the quality of a business over time.

Horizontal Analysis (Trend Analysis)
A horizontal analysis compares financial statements to ascertain how much or in which direction those financial statements have changed over time. A company may have strong visible operational financial management, as well as potential sustainable business expansion.
In contrast, if a company is exhibiting declining earnings over multiple reporting periods, decreasing cash flows, or increasing liabilities over multiple reporting periods, that company may not be financially healthy or may be experiencing declining financial health.
Professional investors use horizontal analysis to identify company momentum, consistency, and possible red flags that are not able to be identified using one company alone. Trend analyses are particularly helpful in making comparisons of company performance through periods of economic transition or market cycle changes.
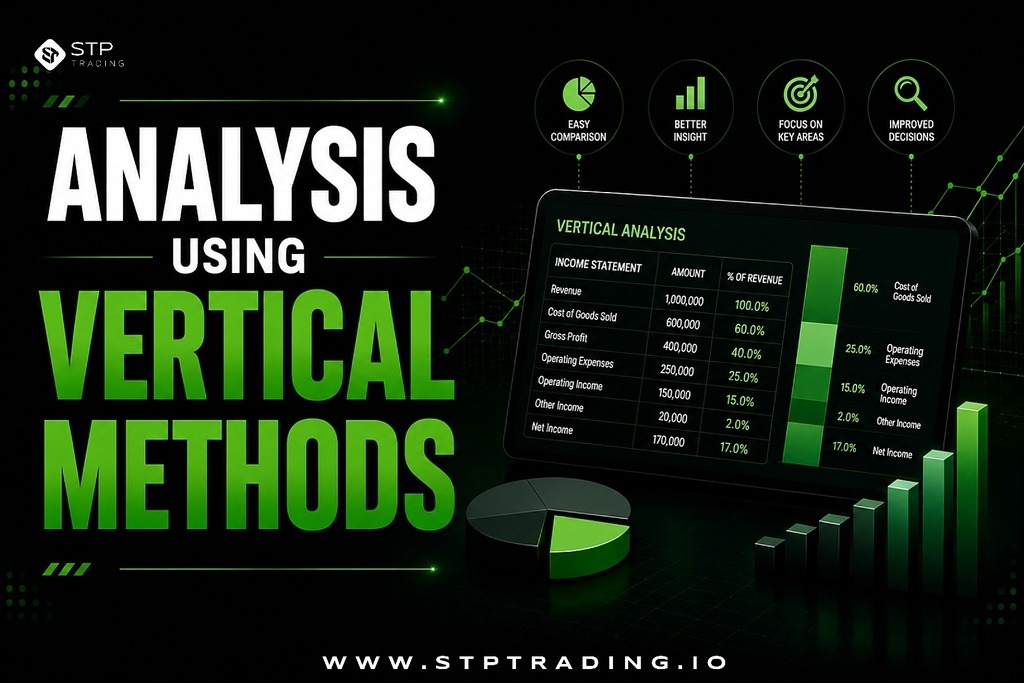
Analysis Using Vertical Methods
Using an approach called vertical analysis means you will view each item included in a financial statement as a portion (or percent) of some total amount in that statement. For example, for an income statement; you would look at every line item in the statement in relation to total revenue.
Whereas, for a balance sheet; you would view each line item as a percentage of total assets. Through this methodology, investors can gain insight into their business’ internal structure of finance.
For example, if operating expenses represent too large a percentage of total revenue, then profitability could become difficult for the business to achieve. Similarly, if excessive amounts of debt represent a significant percentage of total assets, then when the economy slows down there is greater risk of financial hardship to the company.
By performing vertical analysis, traders or investors are able to compare companies of different sizes more efficiently, since they will then have a common percentage base from which to work.
Additionally, vertical analyses can uncover operational problems, cost management problems, or unusual variations in financial data that should be investigated more closely.
Operating Income vs Net Income, Understanding Real Profitability
Beginning investors are often only concerned with net income. In contrast, experienced investors analyze operating income first since that indicator reflects how well the business operates before taxes and unusual one-time items.
If a firm as a result of an asset sale, taxes from another firm, and accounting corrections has reported a strong net income, the core business is probably not earning as much as it could if the operating income is declining.
When investors review stocks with volatile prices, it’s critical to understand that operating income and the related items hold the keys to estimating the potential long term viability of the stock.
Earnings Per Share, The Value of EPS
EPS reflects how much of the business’s profits belong to an individual shareholder. The EPS calculation is as follows:
EPS = ( net income – preferred dividends) / weighted average number shares outstandings
The primary reasons for investors using EPS to evaluate companies include:
- Compare companies
- Analyze profit margin trends
- Evaluate stock price in relation to earnings
However, no experienced investors ever look at EPS separately from cash flow or the entire market. Professionals typically compare the EPS calculation to other performance measures such as cash flows and market conditions to develop a complete picture of the company’s future profitability.
Professional investors typically have access to a number of internet sites that provide real-time company and economy-related information and analysis to determine the impact of changes on EPS & share value while making everyday trading decisions.

How to Review a Balance Sheet Like a Professional Investor
A balance sheet provides a snapshot of a company’s asset, liability, and equity position at any given time. It consists of 3 separate categories: assets, liabilities, and stockholder equity. The basic accounting principle is:
A = L + E
Investors evaluate the stability of a company, its liquidity, the risk of having debt, and efficiency of its operations by examining its balance sheet.
Current Ratio, Can the Company Survive Short-Term Pressure?
The current ratio measures whether a company has the resources to meet its short-term commitments. The formula is:
Current ratio = current assets / current liabilities
Generally:
Above 1 = Good
Below 1 = Possible Liquidity Issues
However, more important than the current ratio of the company is that they compare the ratios of one industry to another industry.
Debt to Equity Ratio, Determining Financial Risk
Too much debt can collapse companies that were previously making a profit during periods of an economic downturn. The debt to equity ratio measures the use of debt for leverage. The formula is:
Debt to Equity Ratio = Total debt / Total shareholders’ equity
If a company has a high debt to equity ratio, this might indicate:
- An aggressive expansion of the company
- The likely financial stress of the company
- The possible bankruptcy of the company
On the other hand, if the company is able to use their debt efficiently, it could potentially create additional growth through their expansion. As before, serious investors evaluate the amount of debt that a company has in relation to its ability to generate cash flow and the amount of interest that a company pays on its debt.
During difficult periods of an economy, this becomes extremely relevant when verified with mechanisms such as economic calendars and central banks notices.
Establishing What You Want to Achieve through Your Financial Analysis
Prior to commencing any form of financial statement analysis, the investor must first clarify their purpose for performing financial analysis. In order to perform an accurate financial analysis, the analyst must be aware of what their intended outcome is going to be and should assess how to achieve that outcome based upon varying characteristics.
For example, if an analyst is considering entering into a trade with a view to holding that trade for just a brief period of time, then the analyst may pay closer attention to earnings momentum and market reaction than an analyst who plans to hold the investment for an extended period of time due to a stable cash flow, sound debt management, and the potential for growth.
An example of this can be seen with dividends. An investor searching for dividend stocks would look at 2 main things, free cash flow and the payout ratio. Conversely, if you look up a growth-oriented investor, that investor will place more emphasis on revenue growth and operating margins to determine how successful the underlying company may be and how long it can continue into the future.
Having a defined purpose of conducting analysis provides investors with guidance on which metrics matter and allows them to avoid being overwhelmed by the volume of information available, thereby helping them to focus their attention on what is truly relevant to their investment strategy or their trading strategy.
Why Analyzing Cash Flow Separates Professionals from Amateurs?
There are many companies that say that they are profitable; however, underlying these results there are also companies that are having severe problems with their cash flow. Cash flow analysis will determine if cash is actively coming into your business.
Cash flow is something that professional investors focus on as being more significant than earnings that have been reported. The cash flow statement will include:
- Cash flow from operations
- Cash flow related to investments
Operating Cash Flow May Be The Most Important Number
Operating cash flows are a measure of cash generated from regular activities conducted within a company or organization. A company with a high operating cash flow indicates:
- Continuity of operation
- Demand for the company’s products
- Financial Stability
Free Cash Flow Is The Key Metric For Sophisticated Investors
Free cash flow is the amount of cash remaining after current operating expenses and capital expenditures have been paid.
Free Cash Flow = Operating cash flow – Capital expenditures
How to Identify Red Flags in Financial Statements
Professional investors spend an extensive amount of their time looking for warning signals. Professional investors do not ignore these types of trends. Red flags that could present themselves in financial statements include:
Rapid Revenue Growth and Weak Cash Flow
Growing revenue, with poor cash flow, may indicate the quality of the revenue could be in question.

Working Capital Grows Faster Than Revenue Growth
Working capital increase without the corresponding increase in revenue may indicate that a company is experiencing financial difficulty.
Accounting Adjustments That Are Often Made
When there are many “one-time adjustments” it is likely that the company will be trying to manipulate their earnings.
Analyzing Financial Ratios Like A Pro
Financial ratios are a way to analyze various companies in an objective manner. The most prominent ratios are the following:
Formula of Price to Earnings Ratio = Share price / EPS
Professional investors will never look at a P/E Ratio without considering the industry relative to the ratio.
| P/E Ratio – High | P/E Ratio – Low |
|---|---|
| The company has increased growth expectations. | The Company is Undervalued. |
| The Company is overvalued by the market. | The Company has weak growth expectations. |
Profitability Ratios, Return on Equity (ROE)
ROE Measures how efficiently the company’s management is using the capital invested by their shareholders. Formula:
ROE = Net Income / Shareholders Equity
ROE – High:
- Strong Management
- Efficient Operations
- Competitive Advantages
ROE – high, but wrongly leveraged, a risk factor associated with a company’s use of too much debt.
Why Industry Comparison Matters in Financial Analysis
A financial ratio can only be significant in relation to other ratios. Example:
- Technology companies’ margins vs. retail company’s margins
- Banks utilize a different model for valuation.
This is where utilizing real-time market analysis tools becomes extremely valuable for short-term traders
The Effect of Macroeconomic Factors on Financial Statements
Financial statement analysis works in conjunction with the broader economy. The performance of a company is greatly affected by macroeconomic conditions. The main influencing economic variables are:
- Interest rates
- Inflation
- Currency fluctuations
- Unemployment
- Central bank policies
You must check out how economic news affects Forex prices too.

Combining Fundamental and Technical Analysis for Smarter Trading
Professional investors usually seek to use more than just one method of analysis to identify opportunities. They use:
- Fundamental analysis
- Technical analysis
- Sentiment analysis
- Economic data
An example would be a trader who finds:
- A fundamentally strong company
- Cash flow growth
- Strong earnings momentum
- A technical breakout based on stochastic oscillator indicators
These four factors create a comprehensive Forex trading strategy. The resources provided to traders by the use of sophisticated indicators, real-time analysis, and anti-margin call systems allow them to better control risk while making a data-driven trade.
Common Mistakes Made By Beginning Investors When Analyzing Financial Statements
Many investors are not aware of how quickly the effects of debt will become problematic in an economic downturn.
- Focusing on revenue as the sole indicator
- Revenue alone tells you very little about profitability or cash flow.
- Not paying attention to debt
- Only analyzing one quarter
- Comparing different industries or sectors
Best Tools for Financial Statement Analysis
While media summaries are helpful, they fail to provide a complete financial picture. Successful investors read original filings and use multiple tools to improve financial statement analyses.
By using a single trading platform that combines financial data with technical tools, beginners and experienced traders benefit tremendously from both types of analysis.
The following resources are helpful in understanding how to perform financial statement analyses:
- Earnings reports
- SEC filings
- Financial ratio calculators
- Advanced charting platforms
- Trading indicators
- Risk management systems
How Long Does It Take to Master Financial Statement Analysis?
Financial analysis is a skill that develops over time. Beginners may struggle initially due to the length of the financial report and the fact that the terminology used may be new; however, what matters more than speed is consistency.
Professional investors gain their skills and expertise by:
- Reading financial reports on a consistent basis
- Comparing various industries
- Studying how various markets have reacted to certain price points
- Practicing common methodologies
- Following macroeconomic cycles for trends
The Smart Investor Is Knowledgeable About Numbers
By learning how to interpret financial reports like a professional investor, you will be able to identify sound investment prospects, avoid bad companies, and create more intelligent trading strategies.
However, being proficient in the analysis of financial statements does not guarantee success; it is also essential that you have a solid platform to execute the strategy effectively and above all else, have the necessary tools.
That is why many traders select to use STP Trading, a platform that allows investors to confidently invest in financial markets. No matter if you are researching various types of trading accounts, performing real-time market analysis, utilizing the economic calendar, or utilizing sophisticated STP indicators, you can have an excellent trading environment that will improve your performance significantly.
If you wish to become an intelligent investor or trader, now is the best time to combine your expertise in financial markets with your expertise with professional trading tools. Begin your registration with STP Trading today and elevate your market analysis.
FAQ for Analyzing Financial Statements
How Do Investors Detect Financial Statement Manipulation?
Investors look for anomalies such as profit growing while the cash flow statement would indicate that there has been no cash generated from operations, unusual accounting adjustments, debt growing rapidly in amount, and receivables and inventory increasing rapidly.
How frequently do investors typically analyze financial statements?
Typically, professional investors will analyze quarterly earnings releases and annual filings on a frequent basis offering them ongoing assessment of how well their investments continue to perform as conditions change.
What kind of impact do economic events have on a company’s financial statement?
Economic events have an impact on financial statements because of inflation, interest rate or economic downturns affecting the growth of revenues, profits, or cost of borrowing and overall financial health.


 Telegram Support
 WhatsApp Support
 Live Chat