Predict the market before its movement. Chart patterns are much more than shapes. Chart patterns are the trail left by intelligent traders. By knowing how to spot these recurrent structures on the charts, traders can predict what will happen next. This guide will reveal how you can learn to read chart patterns and trade on them.
Chart Patterns Explained
Chart patterns are repeated formations that occur as a result of price actions on the chart. They reflect the struggle between buyers and sellers and usually indicate trend continuity or reversal.
Chart patterns are specific patterns seen on a graph through the movement of prices. They are not just random patterns but rather, they are the visible form of market competition taking place all the time in the market between the sellers and buyers.
In basic terms, the patterns that can be found in the charts represent the probable action of the majority of market players. In any market, people are affected by such emotions as fear or greed hence making patterns predictable and useful in trading.
To put it simply, patterns help predict crowd behavior. Patterns in technical analysis help traders to:
- Predict the direction of the price movement
- Determine the right place to enter or leave the market
- Define the levels for stops and profits
Why Chart Patterns Matter for Trading
The main reason why chart patterns work is that markets have a strong psychological component. As people behave similarly under identical conditions, similar structures emerge on charts. Key advantages of patterns:
- Help time trades better
- Ensure clear risk levels
- Apply to any asset type (forex, stocks, crypto)
- Well-combined with Forex indicators and fundamentals
Expand your trading knowledge further and find professional opinions on charts via STP Trading free signals.

Types of Chart Patterns
The analysis of chart patterns gets significantly easier once you start grouping them. Each of them conveys something new about the future of the market. Don’t even try learning all these patterns; pick the top 4 or 5 that give good chances and master those by repeating.
Reversal Patterns, Signals For A Change In Trend
The trend currently being followed will likely reverse. The occurrence of reversal patterns implies that the existing trend is about to shift direction due to a loss of momentum. These patterns usually appear during prolonged trends and imply that traders’ sentiment is about to shift in one direction or another. Main features:
- Emerge after long-term trends
- Consist of several attempts to test resistance or support levels
- Require confirmation (breakout of a neckline or important level)
Continuation Patterns,Trend Will Continue
A brief pause happens prior to the trend continuing. Continuation patterns suggest that the market is simply taking a short break before continuing in the same direction, considering them breathers in a strong trend.
The continuation patterns give you high-probability entries because you are trading in the direction of the trend, or with the trend. Wait for confirmation and use the previous trend as confirmation. Common characteristics:
- Develop during strong trends
- Typically develop on smaller and tighter price ranges
- The breakout will occur in the same direction as the prior trend
Bilateral Patterns, Breakout Can Occur In Both Directions
Depending on market conditions, whether price breaks up or down. The Bi-directional patterns are neutral; they do not demonstrate a distinct direction. Rather, they indicate market indecision, meaning that a breakout could occur either upwards or downwards. Common characteristics:
- Small and Tight Price Ranges
- Decreasing Volatility
- Directional Breakout Determines Your Order
Most Common Types of Chart Patterns That All Traders Need To Know
These classifications will change the way you look at chart patterns forever.
Head And Shoulders Pattern
Reliability is high as this is a reliable reversal pattern. The structure consists of a left shoulder, head (highest peak), right shoulder, and neckline (support level). The signal for a reversal trend will occur when price breaks below the support line (neckline).
Double Top And Double Bottom
It is a very simple and powerful reversal pattern. The lack of momentum to break to each level makes these reversal patterns highly reliable. This signals continuation after a brief pause.
- Double Top (M-shape): Indicates A Bearish Reversal
- Double Bottom (W-shape): Indicates A Bullish Reversal

Ascending, Descending and Symmetrical Triangle
Their use in breakout trading tends to be common among traders. The triangle is one of the most popular instruments used in breakout trading, since they depict very clearly periods of consolidation preceding the breakout.
Upward triangle implies buyers have become more determined, driving prices to higher levels, whereas sellers remain stubborn and defend their flat resistance level. Downward triangle implies selling activity is prevailing, driving prices down, whereas the buyers’ activity remains steady at the same support level.
Logarithmic vs Linear Charts: What’s the Difference in Trading Analysis?

Flags and Pennants
These come after fast moves and suggest the trend will keep going. A flag pattern looks like a small rectangle, although a pennant is a tiny triangle. This signals continuation after a brief pause. They are continuation patterns that follow a large and rapid price movement.
They are acts of the market pausing briefly before continuing in the same direction. The pennant is tighter than the flag indicating that volatility is decreasing and about to expand for the continuation of that same direction.

Cup and Handle Pattern
A bullish shape shaped like a cup with a handle. Main feature, the base forms a rounded bottom, then price pulls back briefly before surging up. The cup and handle shows price moving up after resting buyers pile in quietly.
It’s common in stocks and forex. The drop, then the rise makes a clean u-shape. That’s where smart buyers gather. Then comes the handle, a tiny dip near resistance. A pause before the jump.
When price pushes past the handle, sellers panic. Buyers step in strong. The pullback finishes what’s left of doubt. Entry hits right at breakout level. Stop-loss drops under the handle base.
Usually matches how deep the cup was. It tells you the market mood is shifting toward growth. Works best on daily or weekly charts. Clear lines to enter and leave with.

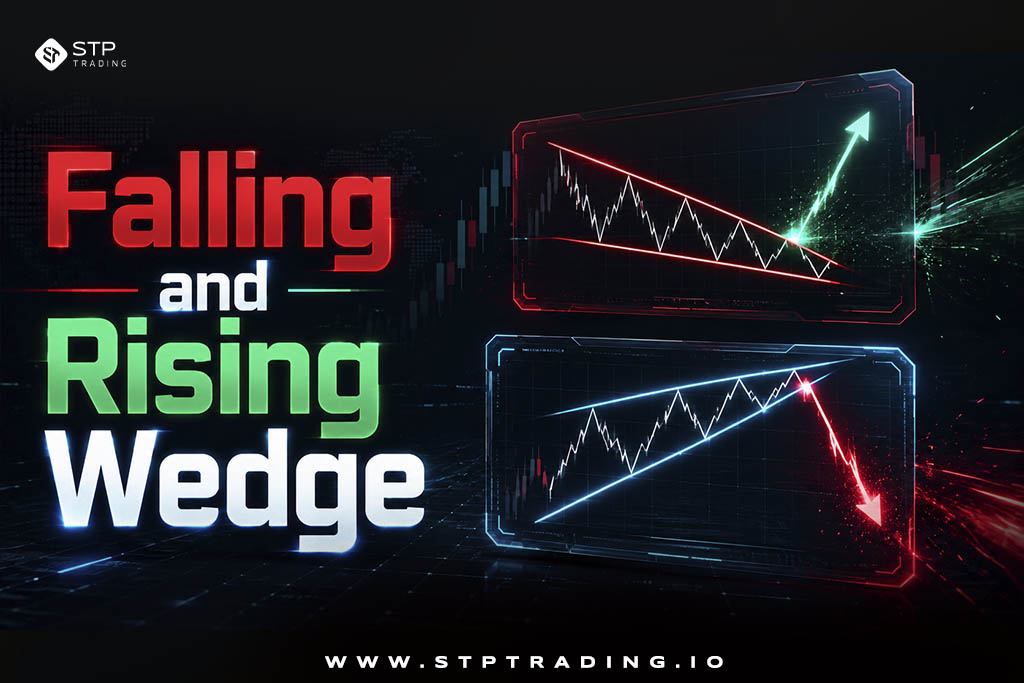
Falling and Rising Wedge
Expect breakout down from rising wedge. The falling wedge is bullish and price is moving downward but narrowing, which indicates that selling pressure is weak. Expect breakout up from falling wedge.
It is a great opportunity to go for a long time.They show that momentum has been lost and open up the price for a strong breakout based on trend analysis.
Examples of Real Chart Patterns in Technical Analysis
Pattern formation is not random; rather, it takes place due to price actions on crucial levels, trader behavior, and current market situation. In general, these setups occur as a result of market pausing and making decisions about its next action.
| Chart Patterns in Technical Analysis | Example Situations Where Patterns Appear |
|---|---|
| Head and Shoulders Pattern | After a strong bullish move, buyers lose momentum → indicates a potential reversal |
| Triangle Pattern | Price consolidates between support and resistance → breakout is likely |
| Double Top Pattern | Resistance is tested twice without a breakout → sellers gain control |
| Flag Pattern | A strong trend pauses briefly → then continues in the same direction |
Top Performer Chart Patterns with Technical Analysis
While there is no pattern that guarantees profits, there are patterns with great consistency and success rates. Profits are made not by identifying the patterns but by executing them properly risk management and market knowledge.
Chart patterns are powerful tools but only if used the right way. Knowing the patterns and how to use them can help traders make money out of the charts rather than losing money on them. All mentioned chart patterns are ideal to use with technical analysis.
What Is the On-Balance Volume (OBV) Indicator and How to Use It in Trading?
Choose a Chart Pattern with technical analysis
Choosing a chart pattern has a lot to do with context. It’s not all patterns that are suitable for every market. Smart traders do not force patterns to fit. They match patterns to the market environment.
| Key Elements to Choosing a Pattern | Details |
|---|---|
| Market Trend | In an uptrend, use continuation patterns. In a downtrend, look for bearish setups. |
| Volatility | In low volatility, use triangles and wedges. In high volatility, use flags and breakouts. |
| Market Phase | In a trending market, use continuation patterns. In a reversal phase, use reversal patterns. |
| Timing | Use reversal patterns at key support or resistance levels. Use continuation patterns in strong trends. Use bilateral patterns in uncertain markets. |
Spot These Patterns Step by Step
First find where the market is heading. Marks key support and resistance lines because patterns build near them. Carefully examine if shapes match known forms such as M, W, triangles, or channels.
You must wait until there’s clear confirmation like breakouts or breakdowns, before acting. Volumes rise when the move confirms strength. It helps verify signals. Add real-world news to your chart review by an economic calendar.
In order to trade chart pattern strategies effectively, it is crucial to select the proper account type among different trading accounts.
| Steps of Trading with These Patterns Correctly | Details |
|---|---|
| Entry Forex Trading Strategy | Enter the trade only after a confirmed breakout or a retest of the breakout level. |
| Stop Loss | Place the stop loss outside the pattern structure to protect against false breakouts. |
| Take Profit | Use measured move targets based on the height of the pattern. |
| Risk Management | Apply proper risk management techniques such as limiting risk per trade and using tools like anti-margin call and hedging strategies. |
Steps to Recognize Chart Patterns in Technical Analysis
A higher timeframe provides better pattern recognition opportunities. Pattern identification requires practice, but there is a clear procedure:
| Chart Pattern Identification Process | Explanation |
|---|---|
| Identify Market Trend | Start your analysis by determining the current direction of the market. |
| Draw Levels of Support or Resistance | Most patterns form around key support and resistance zones. |
| Recognize Pattern Shape | Look for recognizable structures such as M, W, triangles, or channels. |
| Let It Form Completely | Wait for the pattern to fully develop before making any trading decision. |
| Enter After Breakout | Only enter the trade after a confirmed breakout at a key level. |
Tips for Understanding Chart Patterns with Technical Analysis
Consider consistency beats complexity in patterns and use these tips to understand the chart patterns:
- Select clear and distinct patterns
- Combine patterns and volumes
- Look at more than one timeframe
- Never forget about market context
- Practice trading on demo account
How to Trade Chart Patterns with Technical Analysis?
For effective pattern trading, you need structure. Main rules:
- Be patient and wait for confirmation
- Apply stop loss orders to control risk
- Define realistic take profits based on projected pattern size
- Limit yourself to fewer trades
- To enter wait for confirmation candle to close
- If needed, use retest entry

Combining Chart Patterns with More Advanced Techniques
It may seem like trading based on technical chart patterns is enough for success. Yet, when we add other advanced tools into the trading process, we will achieve even greater results. Pattern recognition becomes effective once combined with:
- Trend analysis
- Fundamental news
- Market sentiment
Also consider incorporating hedging strategies into your trading style. When you combine chart patterns with trend analysis, fundamental analysis, market sentiment, and hedge yourself, you create a trading system that goes beyond just identifying patterns to a more professional trading approach.
Chart Pattern Trading Strategies
Knowledge of chart patterns alone does not provide any advantages, the crucial factor is knowing how to trade them. The following advanced techniques are used by professionals to get the best out of each pattern.
Breakout Strategy
The breakout strategy is based on entering the market just after price has broken through a certain level, which can be anything from support, resistance, to pattern boundary. Use it when the price breaks key level. It is best for patterns like triangles and rectangles. Technique:
- Price trades in a consolidation phase (triangles, rectangles, ranges)
- Pressure is accumulating due to the confrontation between bulls and bears
- A breakout happens, triggering a strong move in price
Pullback Strategy
A retest (or pullback) trading strategy is one of the safest ways to get into an event trading situation because you are waiting for the price to get back to its breakout level before you enter.
Breakout and then wait for retest for entry. It comes with higher confirmation and lower risks. It is best for traders that prefer precision over speed.
Trend Continuation Strategy
Trend continuation trading focuses on entering into trades in the same direction of the current trend using continuation patterns such as flags or pennants. Flags and Pennants can be used in strong trends.
The price then breaks out of the flag or pennant to continue in the direction of the trend. You can take advantage of momentum via this strategy.
Reversal Strategy
Reversal strategies help capitalize on situations when a trend begins reversing its course, providing the most rewarding trading opportunities. It is a good strategy for patterns like head & shoulders or double tops and bottoms.
A trend starts weakening due to an extended price movement. Reversals offer great profit opportunities, yet are risky. It is most effective close to resistance or support levels. Use it when price breaks out of the pattern.
Common Pitfalls of Trading Chart Patterns
Successful traders use patterns in conjunction with technical tools, such as STP Trading real time analysis, they also avoid below mistakes:
- Trading without confirmation
- Neglecting the market context
- Overtrading every pattern
- Failing to use stop-loss orders
- Thinking all patterns will work 100% of the time
Become a Master of Patterns, Become a Master Trader
While chart patterns are not a magic wand, they represent one of the closest things we have to a road map of market dynamics. By implementing pattern recognition with discipline, confirmation, and risk management, you become a strategic trader. Ready to start trading patterns, join us via STP Trading.
Frequently Asked Questions about Chart Patterns
Are chart patterns effective for a beginner?
Yes, provided that you have good risk management and confirmation methods.
What timeframe is better for chart patterns?
High timeframes (H1, H4, D1) usually are more reliable.
Is it possible that chart patterns can be wrong?
Yes, chart patterns are not a guarantee, just a probability tool.
Does chart pattern work in any market?
Yes, They work on forex, stocks, and cryptocurrencies; however, volatility affects their efficiency.
How much time do I need to learn chart patterns?
Most of the traders get good results within 3-6 months with regular training.
Should I combine chart patterns with any indicators?
Yes, you should, because it increases reliability.
What is the most reliable chart pattern?
The most reliable chart pattern can be the Head & Shoulder pattern.


 Telegram Support
 WhatsApp Support
 Live Chat