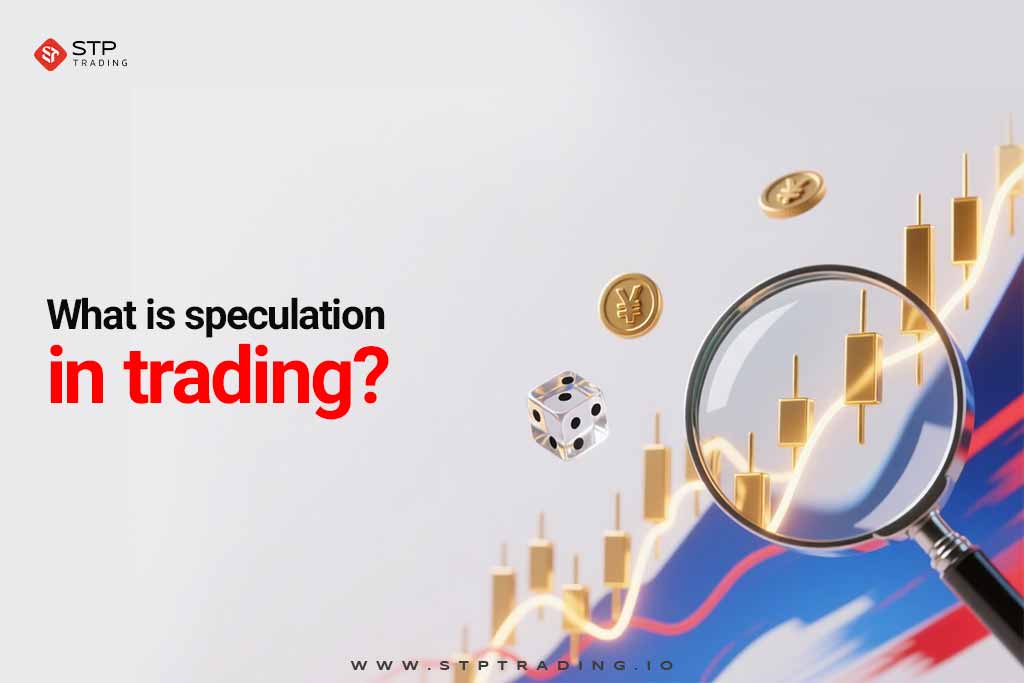
Master the Golden Ratio and Maximize Your Forex Strategy. In the fast-moving world of forex, where seconds are everything, knowing where the market is going to bounce or turn can be the key to profit and loss. Either a novice or experienced trader, grasping Fibonacci retracement levels can hone your strategy and increase your market edge. In this tutorial, we will discuss the justification, strategy, application, and parameters of Fibonacci retracement levels. The tutorial will be divided into four parts: Justification, Strategy, Application, and Parameters.
What Is the Money Flow Index (MFI)?
What Is Fibonacci Retracement?
Fibonacci retracement is a trading technical tool that is based on the large numbers identified by mathematician Leonardo Fibonacci. Employed in trade, it draws horizontal lines on the important percentage levels of a price action.
These levels are based on the Fibonacci retracement golden ratio, which exists in nature, building design, and market action. When a market is trending upward or downward, prices tend to retrace a part of that trend before resuming the original direction. That’s where Fibonacci retracement enters the picture. You can check out Investopedia’s comprehensive guide about Fibonacci retracement levels too.
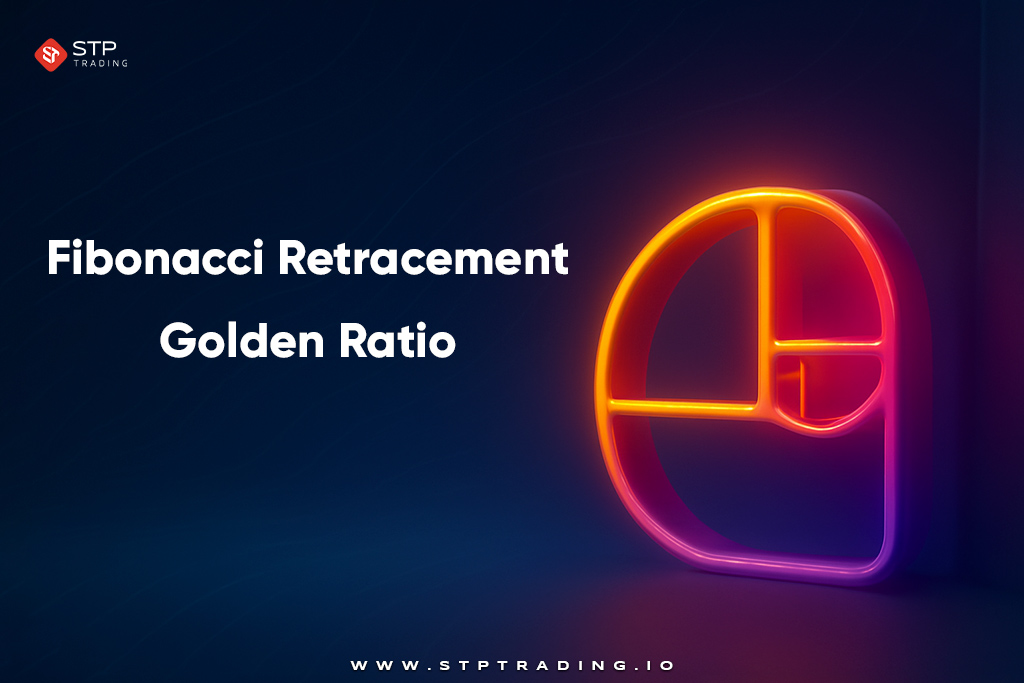
Fibonacci Retracement Golden Ratio
The inverse of the golden ratio is commonly used for marking likely support or resistance levels on a price chart. Other significant levels are either calculated directly from or closely related to the golden ratio.
They help traders predict up to how far a price will retrace before continuing its trend. Because this ratio appears so consistently throughout nature and money trends, many professional traders find it to be a useful forecasting tool in uptrends and downtrends both.
What Is the Straddle Strategy in Forex?
Dead Cat Bounce in Forex Strategy
Common Fibonacci Retracement Levels
Key Fibonacci retracement levels most commonly utilized in forex trade include:
- 23.6%: This level is a shallow retracement and is widely used in strong trends.
- 38.2%: This is generally the first deep retracement level where a more noticeable reaction is expected by traders. If the price has support (in an uptrend) or resistance (in a downtrend) at 38.2%, it has the tendency to confirm the resumption of the dominant trend. It’s commonly used for setting tight stop-losses or early entries.
- 50%: Not a Fibonacci ratio but a ratio used by traders, the 50% level is based on the principle that a market will retrace half of a prior move before the trend continues in the direction of the trend. Traders watch this level closely for high-probability bounce trading opportunities when combined with other indicators.
- 61.8% — The Golden Ratio: This is the strongest Fibonacci retracement level. This 61.8% is also referred to as the golden ratio and is a “make-or-break” zone. If the price retraces this far but not beyond, it will often lead to a strong continuation. If it breaks it, it can signal a trend reversal. Some traders rely on this level for their strategies as it holds very high predictive value.
- 78.6%: This deeper retracement level is the trend’s final line of defense. If price retraces beyond this level, it typically means the trend is reversing. However, when price bounces at 78.6%, it has the potential to make very sharp reversals in the direction of the trend, making it a contrarian trader’s delight.
- 100% and Beyond: The 100% level marks a full retracement of the price movement. Below 100%, traders use extension levels like 127.2%, 138.2%, and 161.8% (Fibonacci extension levels) to forecast price objectives after breakouts.
Why and How Fibonacci Levels Boost Your Forex Trading
Fibonacci retracement levels are not just figures, they are likely the most effective technical analysis tool. Their biggest benefit is to allow traders to anticipate potential reversal zones, plan smart entry and exit points, and follow disciplined risk management.

That is where Fibonacci retracement levels are an essential instrument for Forex technical analysis. Scalping intraday or swing trading major currency pairs, this is how Fibonacci retracement levels can boost your trading strategy:
High-Probability Spot Reversal Zones
Price does not normally move in a line in the forex market. It occurs in waves, so the levels of Fibonacci retracement are ideal for identifying where pullbacks will have a tendency to stop prior to the trend resuming.
Those levels like 38.2%, 50%, and 61.8% are typical areas of support/resistance and are monitored tightly by retail and institutional traders. They have a tendency to become self-fulfilling areas of interest where trades may be entered.
Generally, you can use Fibonacci Retracement Levels’ tools for correct Forex market prediction.
Plot Low-Risk Entry Points
Instead of going into a trade on hope, Fibonacci retracement allows you to wait for price to have pulled back to a logical level in the trend before getting in. In an uptrend, for example, a pullback to the 50% level that’s supported by a bullish confirmation indicator (like a strong candlestick pattern or RSI bounce) can be a very good time to buy.
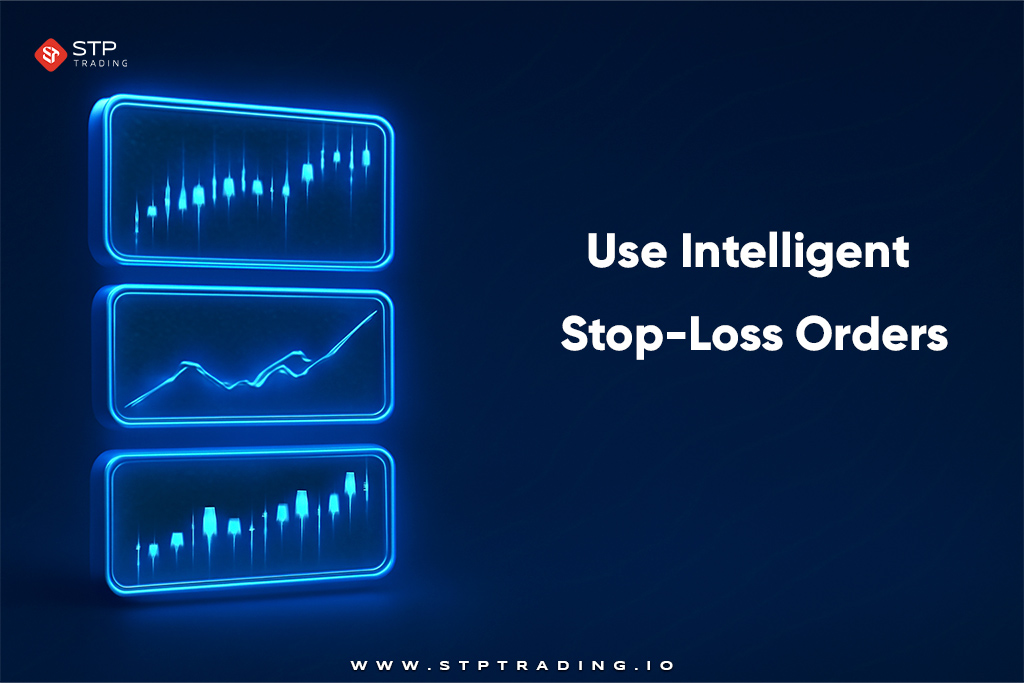
Use Intelligent Stop-Loss Orders
Emotionally set stop-losses result in unnecessary stops. Applying Fibonacci, you can set your stop loss right above the following retracement level where there are fewer false breakouts.
For instance, going long at the 50% level, having your stop set just below 61.8% incorporates technical structure into your risk management.
Using Dow Theory for Effective Forex Trading Strategies
Control emotional trading
Fibonacci retracement creates a rule-based trading method. You don’t speculate where price might turn; you utilize quantified, pre-defined areas to make your trade. This cuts down on impulse trades and provides psychological comfort, especially in market volatility.
Want to be even more accurate? Use Fibonacci levels together with Forex sentiment analysis and indicators, which tell you where most of the traders are.
Improving Risk/Reward Ratios
Fibonacci retracement levels therefore enable better planning of trades, especially when superimposed over extension levels or previous price structure. By selling at significant retracement points and taking objectives at or near previous highs/lows or Fibonacci extensions ,the traders are able to create setups with 1:2,1:3 , or improved risk/reward ratios.
This allows consistent profitability even if your winning percentage is no greater than 40–50%, so it is ideal for discretionary or rule-based strategies.
Use It as part of a More Robust Risk Management System
Fibonacci Retracement is one of 10 risk management strategies in Forex and combined with other strategies like sentiment indicators, economic calendar events, and volume analysis, the ability to manage risk correctly and confidently is enhanced.
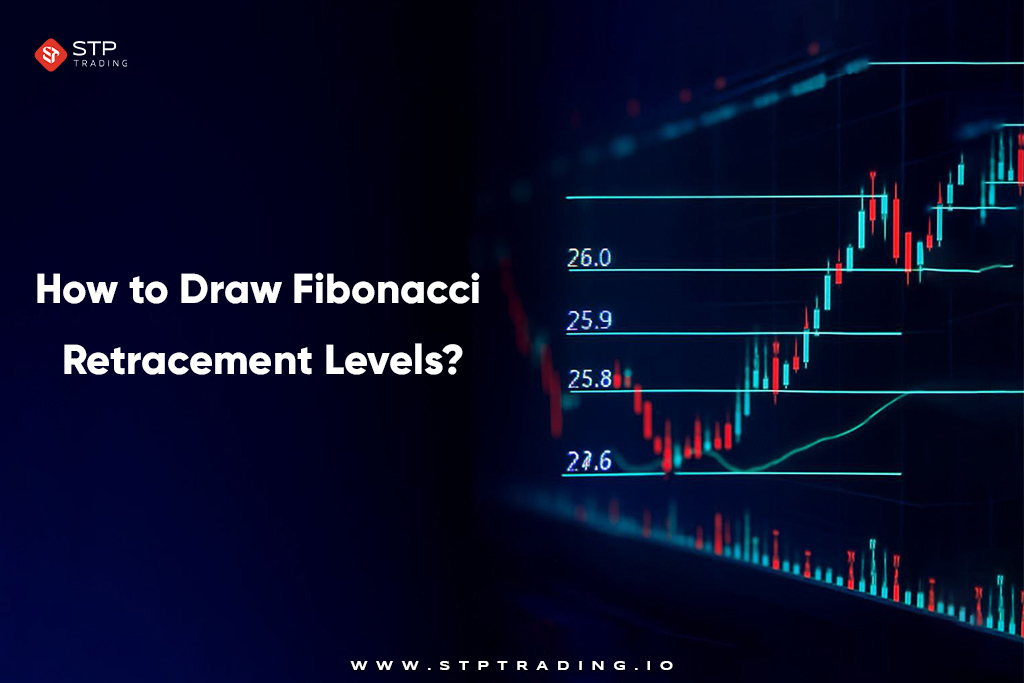
How to Draw Fibonacci Retracement Levels?
Before applying Fibonacci retracement levels on your chart, it’s important to understand the psychological foundation behind how and why they work. Markets move in waves, expansion and correction.
These levels are areas where price can short-term reverse, stall, or consolidate before resuming its trend. Because many traders are applying Fibonacci levels at the same time, they may become self-fulfilling, especially when used in conjunction with other technical indications.
The key to successful application of Fibonacci retracement lies in your ability to identify swing highs and swing lows. These markers are the beginning and end of a significant price move and are used as anchors to the retracement tool.
The lines formed by the use of the retracement tool from these 2 anchors will subsequently be utilized as potential areas where the market could respond. Market context also needs to be added.
Step-by-Step Guide: How to Draw Fibonacci Retracement in Uptrend
When the market is in an uptrend, it makes higher highs and higher lows. The concept when drawing Fibonacci retracement here is to find out where the price will likely pull back (retrace) before continuing with an upward trend. These points of retracement will be probable support levels.
- Identify the swing low and swing high
- Find the last important low (start of the rise) and the last important high (end of the rise)
- This is the “impulse wave” of the trend
- Select the Fibonacci retracement tool
- Most charting programs like MetaTrader, TradingView, or STP Trading’s platform have it as an option under the drawing menu
- Draw from low to high
- Select the swing low and drag the retracement tool to the swing high
- The Fibonacci levels will automatically plot below the top point
- Examine retracement levels as a potential buy opportunity
During a strong trend, the price will usually only retrace to the 38.2% level before continuing. During weaker trends or following news events, retracements to 61.8% or 78.6% are common.
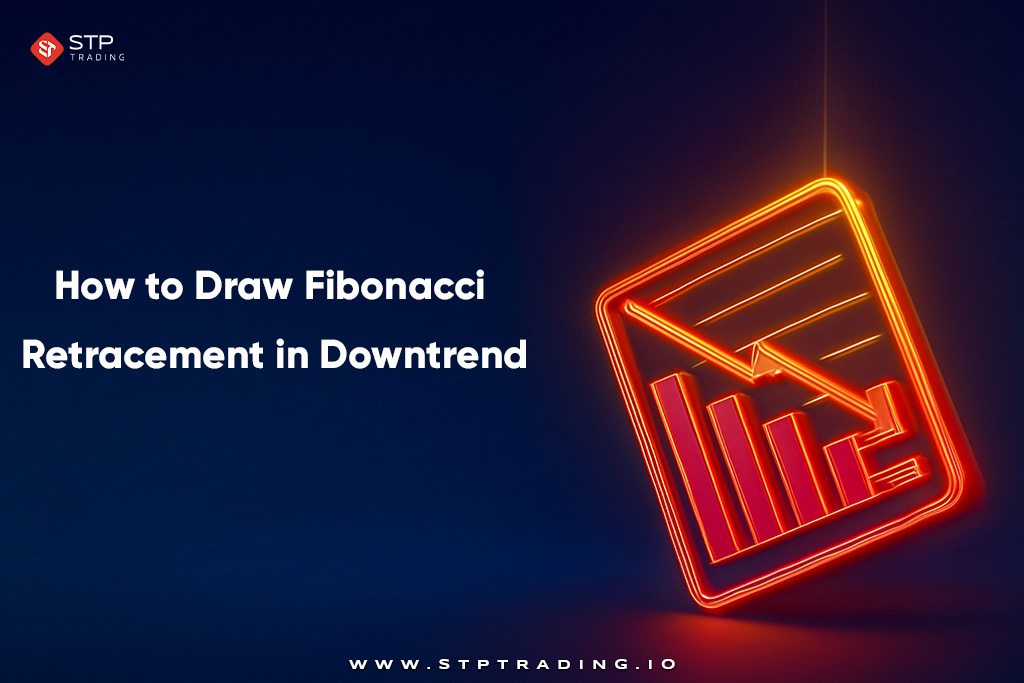
Step-by-Step Guide: How to Draw Fibonacci Retracement in Downtrend
Downtrends of retracement are potential areas of resistance. In case of drawing Fibonacci Retracement levels, follow the below instruction:
- Identify the swing high and swing low
- Start at the latest major high (beginning of the down move) and the major low (termination of the down move)
- This forms your impulse wave in the down move
- Draw from high to low
- Select the Fibonacci retracement tool and click on the swing high, and drag it down to the swing low.
- The Fibonacci levels will then be higher than the low, giving the resistance levels
- Monitor the retracement levels for the short entries possibility
- Notice how the price acts as it rises towards these Fibonacci levels. If the price is reaching the 50% or 61.8% level and showing bearish rejection signs (e.g., bearish engulfing candles, overbought RSI), this would be a strong signal to go short
In high-momentum downtrends, the price may only barely touch the 38.2% retracement level before continuing its bearish trend. On slower corrections, the retracement will be more profound—up to the 78.6% or even 100% level.
Best Time Frame for Fibonacci Retracement
The timeframe you employ to use Fibonacci retracement is highly significant as it determines the validity and accuracy of the levels you draw. It is effective as the size and quality of the price action you use dictates effectiveness.
That means your selected timeframe must be suitable to your goals of trading—whether it is scalping short-term movements, swing trading trends or long-term investments.
Fibonacci retracement is a multi-time frame indicator and can be used on anything ranging from a 1-minute chart to a weekly chart. However, its usability and accuracy depend on the time horizon.
You can also use multi-timeframe fibonacci analysis. Apply a smaller timeframe (e.g., 1H or 15M) to achieve very exact entries and exits within that larger trend. If Fibonacci levels on 2 or more timeframes overlap, the area becomes a high-confluence region, so the reaction is more probable.

Intraday Traders: 15 Minutes to 1 Hour
Can I use Fibonacci retracement for intraday trading? The answer is yes. Such timeframes are sensitive to short-term price actions and allow you to:
- Identify precise pullback zones in crazy hours (e.g., London or New York session opens)
- React swiftly to breakout or bounce confirmation
- Use tighter stop-loss and faster profit booking
For example, during the London session, EUR/USD can move 50–70 pips. You can draw Fibonacci from swing low to swing high on the 15M chart to capture retracements at 38.2% or 61.8% with high probability.
Better time news with the Forex Economic Calendar, retracements around major events can be highly profitable. Use it with price action during periods of high volume.
Fibonacci retracement strategy for intraday means to use this tool along with pivot points and moving averages to confirm. Then wait for a reversal candlestick pattern at a level of retracement before entering.
Swing Traders: 4-Hour to Daily Charts
Swing traders, who are ready for a couple of days, are assisted by working on 4H or daily charts. These timeframes provide more accurate representations of medium-term market structure and trend retracements. The reasons why Fibonacci is powerful here are:
- It describes deeper pullbacks within larger trends.
- It makes it easier to define entry zones with higher stop-loss and reward potential.
- It allows for confluence with patterns like head and shoulders, triangles, or channels.
Example: A swing trader who wishes to buy GBP/USD can note a daily uptrend. The price reverses after advancing 300 pips. A Fibonacci from the latest swing high to low shows support at 50%—a great potential re-entry point.
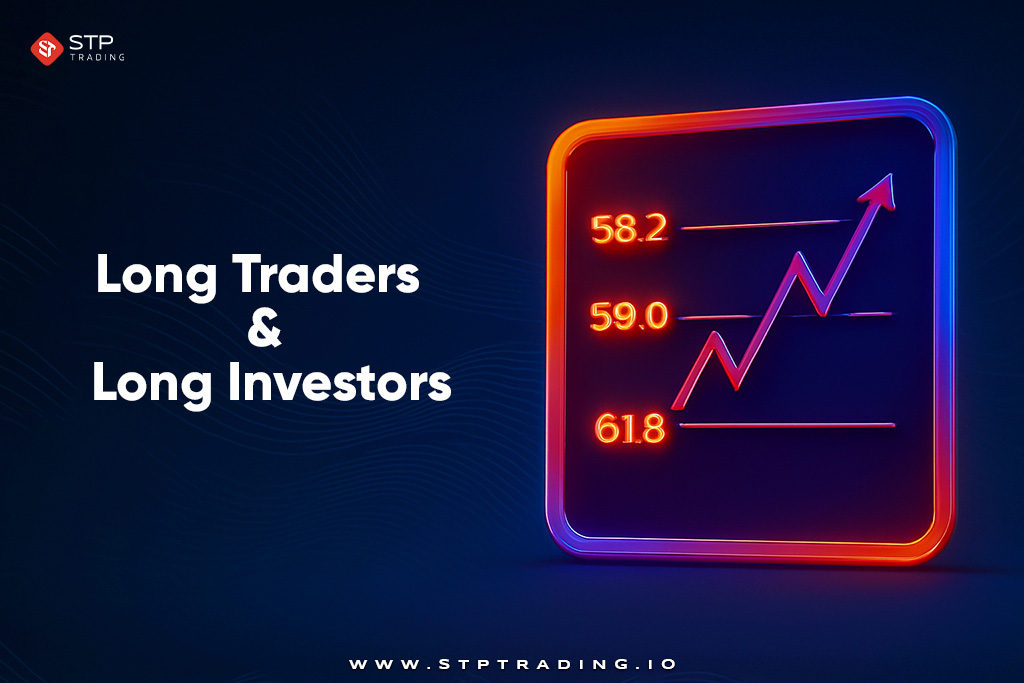
Long Traders & Long Investors: Daily to Weekly Charts
Long-term traders and investors who ride multi-week or multi-month trends need to employ Fibonacci retracement levels on daily and weekly charts. These higher time frames help with the following:
- Discovering macro-level retracements in large currency pairs
- Identifying institutional support/resistance levels respected over years
- Making positions with large stops and gargantuan profit targets.
For instance, going back Fibonacci from a pandemic-era low to a two-year high on the EUR/USD weekly chart can identify major pullback levels where the market could retest before resuming its multi-month trend.
For choosing the most suitable approach for your trading style, you can gather more information about different types of trading accounts.
Common Fibonacci Retracement Settings
While default figures on most systems report, there are also more seasoned traders who can set levels for increased sophistication. Some of the Best Fibonacci retracement settings would be:
- 127.2% and 161.8% – Typically used as extension levels for profit targets.
- 38.2% & 61.8% – Highly respected in forex and stock markets.
- 0.5 (50%) – Not a Fibonacci number, yet highly recognized among traders.
Fibonacci retracement levels above 100 are typically employed to:
- Offer profit targets after breakouts.
- Project areas of price exhaustion.
This approach is especially useful for trend followers looking to catch large moves beyond usual levels of retracement. Require calculation assistance? Utilize a Fibonacci retracement calculator to obtain levels instantly.
Fibonacci Retracement Strategy for Forex Trading
In the trading process, knowing what is Forex strategy is not enough. The overall concept is to identify areas where the price will probably pause or briefly turn around prior to continuing again in the original direction.
These areas are good places to initiate trades with a favorable risk-reward profile. You can use these strategies and enhance them with confluence tools like RSI and expert advisor (what does EA mean in trading?)

Entry Point: Timing Your Trade at Key Levels
Once you’ve charted your retracement levels, the most commonly seen entry points are 38.2%, 50%, and 61.8%. These are typically solid pullbacks in a trend where players are taking profit or new buyers/sellers enter to continue the trend.
For getting to know when to apply Fibonacci retracement levels in an uptrend and downtrend you can refer to the step by step guide of drawing these levels.
For example, when the 61.8% level coincides with a robust previous support level or the 200 EMA, the chances of price reacting there are even higher.
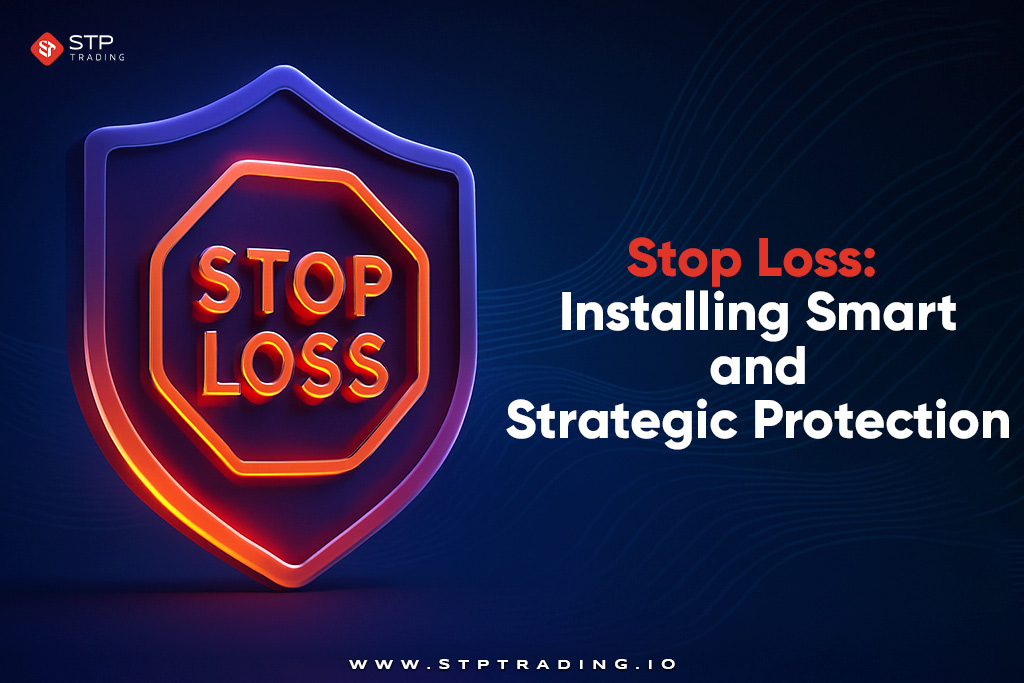
Stop Loss: Installing Smart and Strategic Protection
A successful Fibonacci retracement strategy is not without a smart placement of a stop-loss. The idea is to leave room for the trade while keeping your capital secure in the event that the trade does not work out.
In a long position, the stop loss is usually placed below the subsequent Fibonacci level lower than the entry (e.g., below 61.8% if entering at about 50%). For short selling, the stop is usually set slightly above the next level above entry.
Take Profit: Extension of Extremes and Old Highs/Lows
Your take-profit plan needs to be as planned out as your entry and stop. Fibonacci extension levels (for example, 127.2%, 161.8%, or 200%) are frequently used by traders as entry targets when buying on a retracement.
During an uptrend, your initial target would be the recent high (100%), and the next target would be 127.2% or 161.8% past that. In a downtrend, your initial target can be the last low, with extension levels below being taken for higher profits.
Another popular method is to employ take-profit using risk-to-reward ratios. If your stop loss is 20 pips, you can set your take profit at 40–60 pips to have a 1:2 or 1:3 ratio.
This will make you profitable over the long run even when you are only winning half your trades.
How Professional Traders Use Fibonacci Retracement
You might ask: Do professional traders use Fibonacci retracement? Yes, they do. Professional forex traders—particularly institutional, hedge fund, and proprietary traders—are indeed employing Fibonacci retracement, but theirs is a much more strategic, sophisticated, and data-rich approach than that of retail traders.
They don’t use Fibonacci levels in isolation as signals. Rather, they incorporate Fibonacci into an elaborate decision matrix that encompasses market structure, zones of liquidity, order flow, and cross-market correlations.
These speculators realize that Fibonacci levels of retracement are universally followed and frequently part of algorithms and institutional programs.
What is Hedging in Forex and How Does it Work?
Therefore, price reactions at these levels can turn into self-fulfilling turning points, not magic, but because there are already numerous orders queued up around them. Professionals utilize this propensity by expectation, not reaction, typically in the form of tiered orders (scale-in and scale-out) around Fibonacci groups. Top traders do not use Fibonacci alone—but rather in conjunction with:
- Trendlines
- Moving Averages
- Support & Resistance
- Volume Analysis
- Price Action
Fibonacci retracement works best when executed with the right broker as well as the right strategy. STP Trading gives you an edge by providing ultra-fast trade execution, and therefore you do not miss essential entry and exit points as per Fibonacci levels.
On top of that, STP Trading provides access to advanced tools for real-time market analysis, including an enhanced Forex Economic Calendar and Free Forex Signals, which help you connect Fibonacci setups with market sentiment and Forex fundamental analysis or trends.

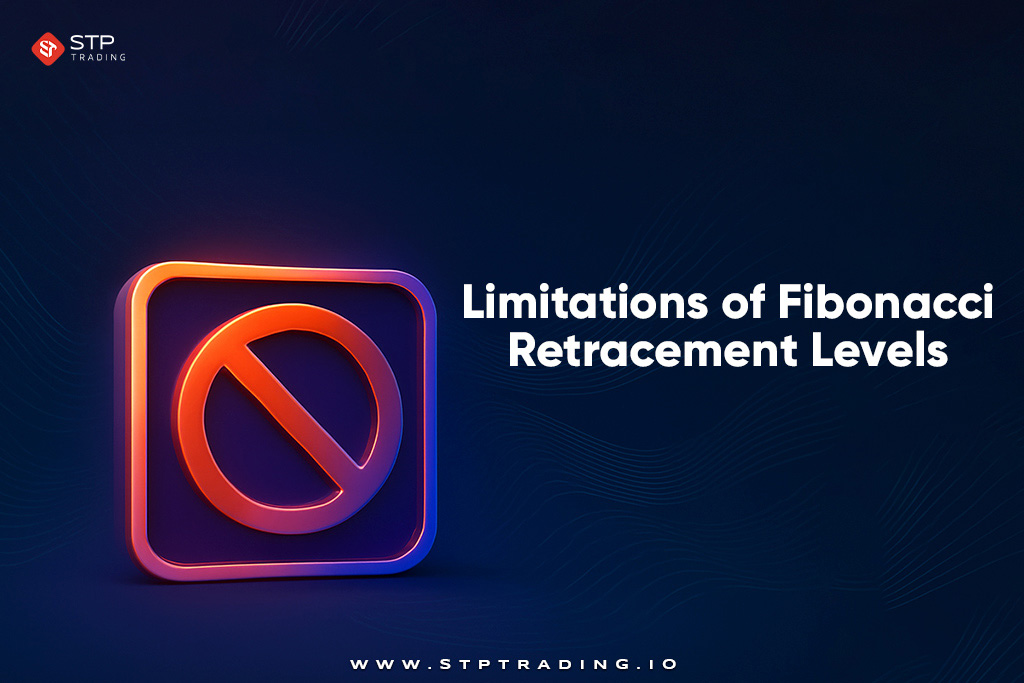
Limitations of Fibonacci Retracement Levels
No Guarantee of Reaction at Levels Fibonacci is the most important limitation. Levels are based on mathematical ratios, not on underlying factors or true market movers.
The fact that a retracement level is on a chart does not ensure that the price will react to it. There are plenty of examples where prices cut through multiple Fibonacci levels without making any substantial turn.
Traders must beware of assuming that these levels will always hold. Subjectivity in Swing Selection is another limitation. Drawing Fibonacci retracement lines depends on the trader’s choice of the swing high and swing low.
Different traders may choose different points to calculate retracements, which will create moderately different retracement levels on the chart. This subjectivity can create inconsistencies and render signals less dependable if used exclusively.
Lagging Nature is also one of Fibonacci Retracement Levels’ limitations. Like most technical tools, Fibonacci retracements are reactionary, not predictive. Some sites like ig.com provide complete information about these limitations.
Turn Fibonacci Retracement Levels into Your Trading Edge
Fibonacci retracement levels aren’t theory – they are an in-the-trenches tool that successful traders utilize in order to gain an edge within the wildly volatile forex market.
By identifying potential reversal zones and synergizing them with overall technical indicators, you can create smarter entry and exit points, more effectively manage your risk, and trade more assuredly.
Regardless of whether you perform intraday movement or swing trade, Fibonacci retracement can be the advantage to exploit to locate high-probability trades. Fibonacci retracement provides you with all that in one tool. Now that you know how it works and how to use it, go out and practice it. Ready to take your trading to the next level?
Let’s open your account at STP Trading and experience world-class trading tools, fast execution, and expert assistance. Whether you’re new to trading or refining your edge, Fibonacci retracement combined with the right platform can help you trade smarter—not harder.
FAQ
Are Fibonacci retracement levels good under all kinds of market conditions?
Fibonacci retracement performs best in trending markets. Under sideways or highly volatile markets with no apparent trends, their predictive power is much lower.
How often should we redraw Fibonacci retracement levels?
Varies with the timeframe and market condition. Daytraders would redraw levels frequently as new swings are formed, while longer-term traders draw after significant trend reversals.