
The Trick That Costs Millionaire Traders. In this fast-paced world of forex trading, every chart tells a story, but not all of them have a happy ending. Picture this: you are watching what appears to be a strong bullish breakout. The candles are pointing upwards, the indicators are green, and traders are buying large amounts expecting to ride a powerful wave up. Suddenly, and unexpectedly, the price drops back down, trapping late buyers at the peak. This is what experts refer to as the Forex Bull Trap Strategy, a deceptive price action that lures traders into false hope.
Learning about bull traps is a reality check, not just a theory, on how to protect your capital from one of the market’s most hidden emotional manipulations. In this article, we will discuss how a bull trap operates, how to identify it, how to avoid getting caught up in it, and how it differs from other misleading signals. Most importantly, we will demonstrate to you how to choose a good broker. A reliable broker can simplify investing for you, providing you with the information, openness, and support required in order to be able to safely navigate away from such market pitfalls.
What Is the Straddle Strategy in Forex?
What Is a Strangle Strategy in Forex?
What Is the Whipsaw Forex Strategy?
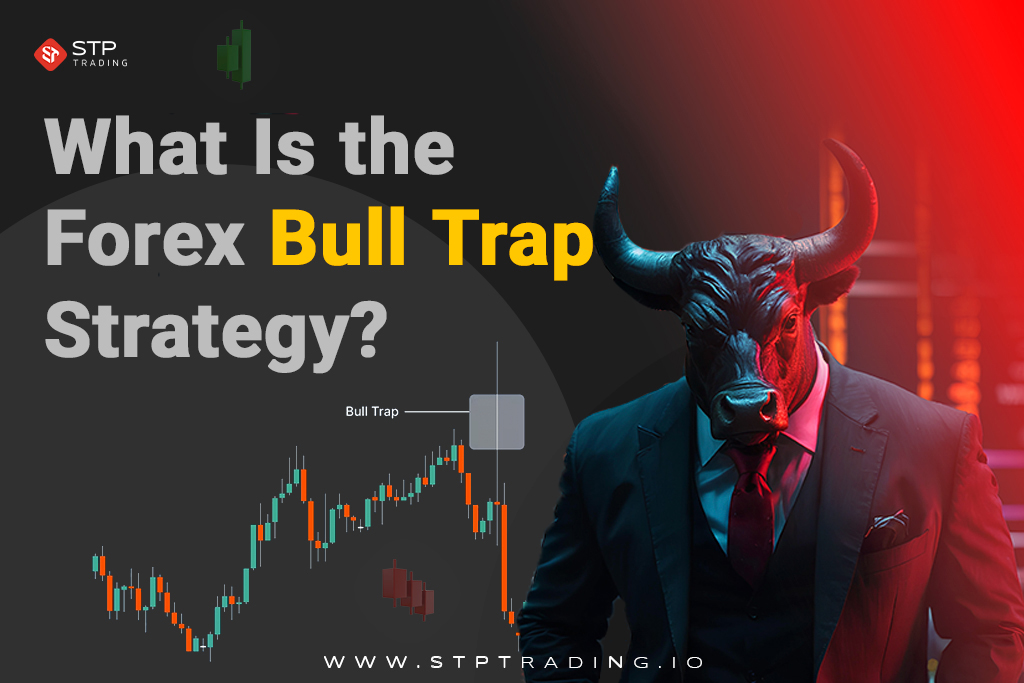
What Is the Forex Bull Trap Strategy?
A bull trap in forex occurs when traders are deceived into buying because a currency pair seems to be breaking out above a resistance level, indicating an uptrend.
Instead of continuing upward, however, the price quickly reverses, resulting in losses for those traders. Bull trap Forex strategy is how traders try to identify and evade these traps, or for more experienced professionals, how they capitalize on them by staying one step ahead.
Essentially, it is not just about recognizing when the market is deceiving us, but staying ahead of the deception.
What Triggers a Bull Trap in Forex?
A bull trap doesn’t happen accidentally; it’s the result of a combination of market psychology, technicalities, and sometimes external factors that create the perception of a breakout. Having knowledge of the following causes keeps traders on guard before it devours them.
Market Manipulation by Big Players
Sometimes institutional traders or “smart money concepts” will push the price beyond resistance merely to provoke retail traders into a purchase. Once enough buying orders are placed, these big players offload their holdings, hence the price corrects sharply. This is the usual bull trap scenario where small investors incur losses.
Low Liquidity Conditions
During lower liquidity sessions or in pairs, it is easy for the prices to move wildly. With a slight push higher than the resistance level, it might look like a breakout, yet it doesn’t carry through without strong market support. This happens during off-hour trading or even among less popular currency pairs.
Overconfidence and FOMO
Trader psychology is the basis of most bull traps. Once traders see what seems to be a firm breakout, fear of missing out prompts them to buy before confirmation. This stampede of impulsive buying creates the bait-and-switch false move that results in the reversal.
News and Economic Events
Major news like central bank announcements or employment reports can cause abrupt, short-term price spikes. Traders typically interpret these as breakouts, but once the initial reaction has passed, the market reverses into a bull trap.
Exhausted Uptrends
Following an extended rally, the buying pressure naturally runs out of steam. When the price finally breaks higher through resistance, it usually doesn’t have the strength to go further up.
The failed upward push becomes the trap for the bull as the market runs out of energy and turns over.
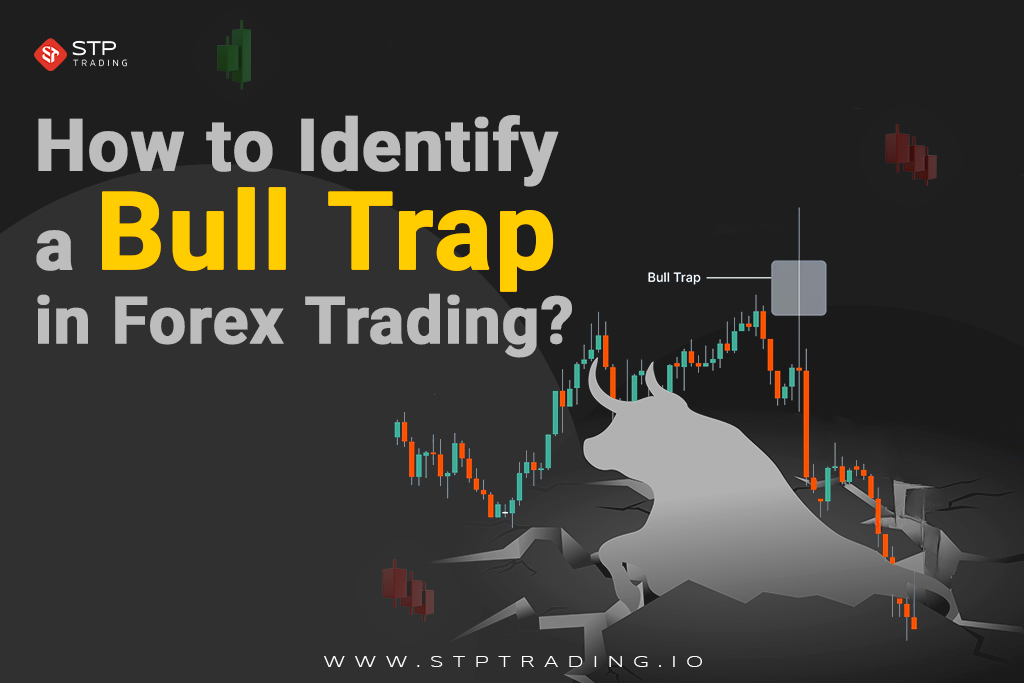
How to Identify a Bull Trap in Forex Trading?
One of the most crucial skills for a trader to have is the skill to identify a bull trap in forex trading. Bull traps are misleading, appearing as genuine breakouts and leading the traders to believe that the market will establish a strong bullish trend.
The challenge is being able to identify real breakouts and false breakouts. In order to achieve this, the traders need to observe technical Forex signals closely, context of the market, and confirmation through volume.
Instead of leaping into a trade when there is only the suggestion of upward movement, it’s required that you:
- Pause
- study the setup thoroughly
- watch for the warning signs usually present for a bull trap.
These are the primary indications that will help you recognize and avoid getting trapped in a bull trap:
Low Volume on Breakouts
A breakout with abnormally low volume is a strong indication of a bull trap. Always determine if the breakout is followed by genuine market activity.
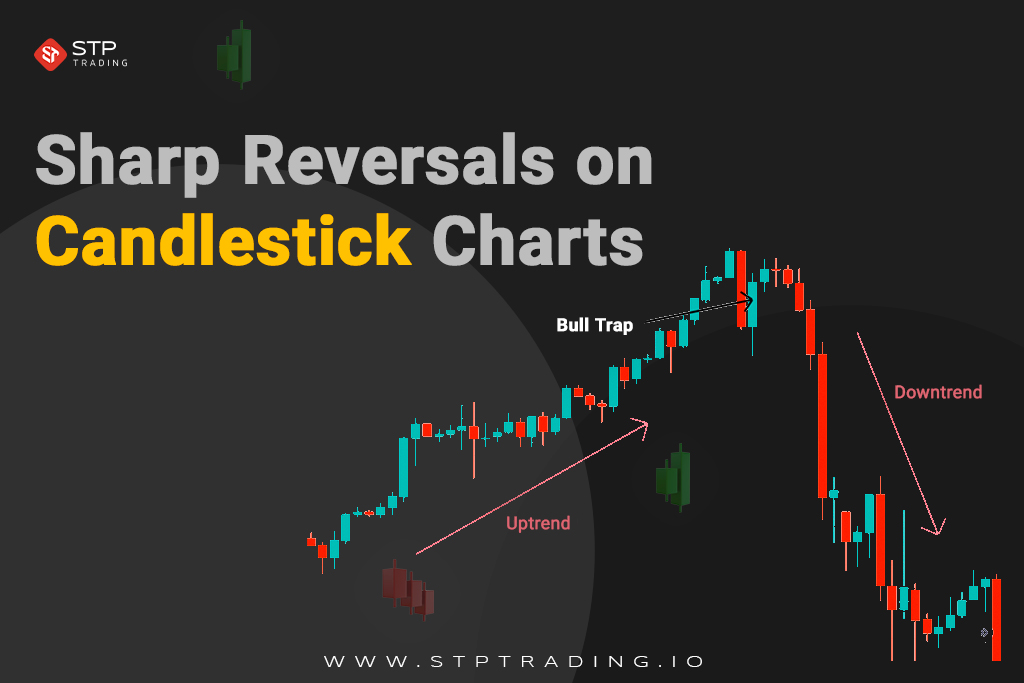
Sharp Reversals on Candlestick Charts
Candlestick formations are wonderful to look at when searching for bull traps. Candlestick analysis is among the finest ways of identifying a bull trap. Candlestick charts not only reflect price action but also sentiment.
When a breakout above resistance happens but the follow-up candles have long upper wicks, small bodies, or bearish reversal patterns, it is a sign that buyers’ strength is weakening.
Patterns like the shooting star, bearish engulfing, or evening star indicated sellers are taking control. For instance, when a currency pair jumps above resistance at 1.2000 with a strong green candle and subsequently a shooting star candle, it is an indication that buyers attempted to drive upwards but were pushed aside by sellers.
This rapid movement indicates the possibility of a false breakout, and traders have a chance to retreat before the trap is in effect.
Using Dow Theory for Effective Forex Trading Strategies
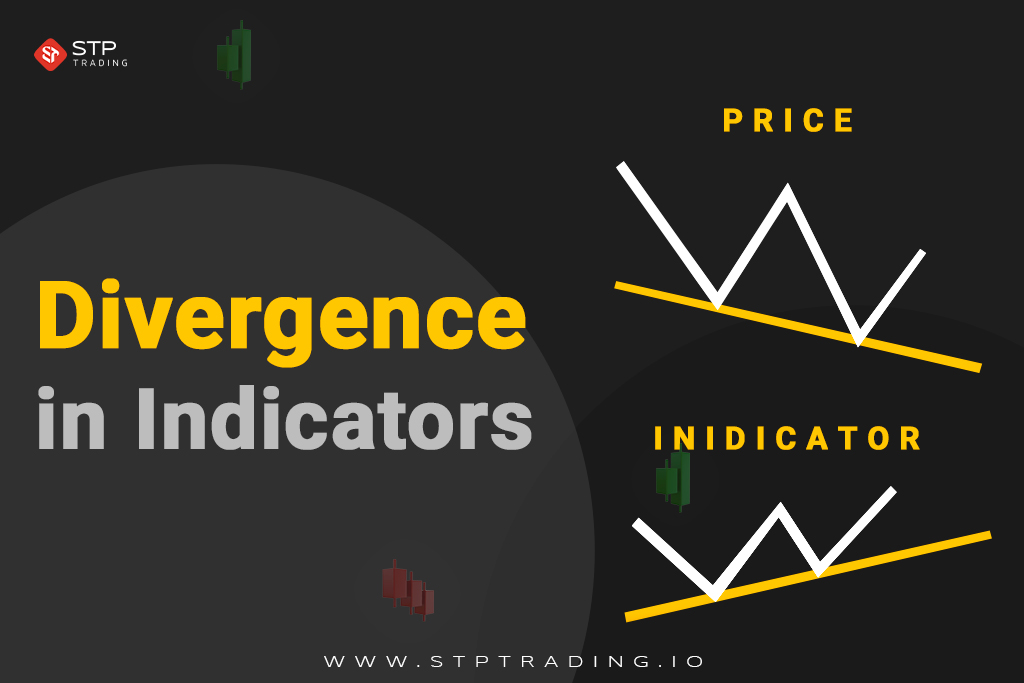
Divergence in Indicators
Traders who ignore these indications tend to fall prey to false optimism. While price action is the basis of analysis, technical indicators can point out hidden weaknesses in a movement.
Divergence is a condition where price action and technical indicators such as RSI, MACD, or Stochastic Oscillator are heading in opposite directions. For example, in a bull trap, the price may be forming higher highs but the RSI can form lower highs, i.e., momentum is losing strength.
This price-momentum mismatch is a common indicator that the breakout is weak. The traders who ignore this divergence become victims of false hope and believe the breakout to be real.
In fact, the divergence is the market’s covert indication that a reversal is imminent. Adding these signals to your trading arsenal offers a confirmation level and can greatly minimize the possibility of falling prey to bull traps.
Previous Market Context
By moving back to higher timeframes and looking at the overall trend direction, it becomes easier to determine whether a breakout is real or a short-term trap designed to lure unsuspecting buyers.
Bull Trap Example
Let’s consider the EUR/USD currency pair, which has been trading in a range for several days with 1.1000 acting as a strong resistance level. Traders are patiently waiting for a potential breakout.
When EUR/USD breaks above 1.1000 and closes at a 1.1020 with a strong bullish candle, many traders interpret this as a breakout and quickly open long positions, anticipating a rise to 1.1100.
Initially, the price remains just above the resistance level for an hour, boosting traders’ confidence. However, the light volume and bearish divergence on indicators like RSI suggest that the breakout may not be of high quality.
Suddenly, aggressive sellers return to the market. Within hours, EUR/USD falls back below 1.1000, triggering stop-loss orders for buyers who were trapped in the trade. Selling pressure intensifies, causing the pair to plummet to 1.0950.
Traders who entered at 1.1015 or 1.1020 find themselves at a loss, while more experienced traders who recognized the signs of a bull trap either stayed out of the move or even profited by shorting near the resistance level.

Introducing Bull Trap Charts
Charts are where the reality of a bull trap is most evident. Technical definitions are useful for understanding the concept, but a bull trap chart Forex visually demonstrates how traders are lured into a false sense of security. The following explains how a bull trap unfolds on a forex chart.
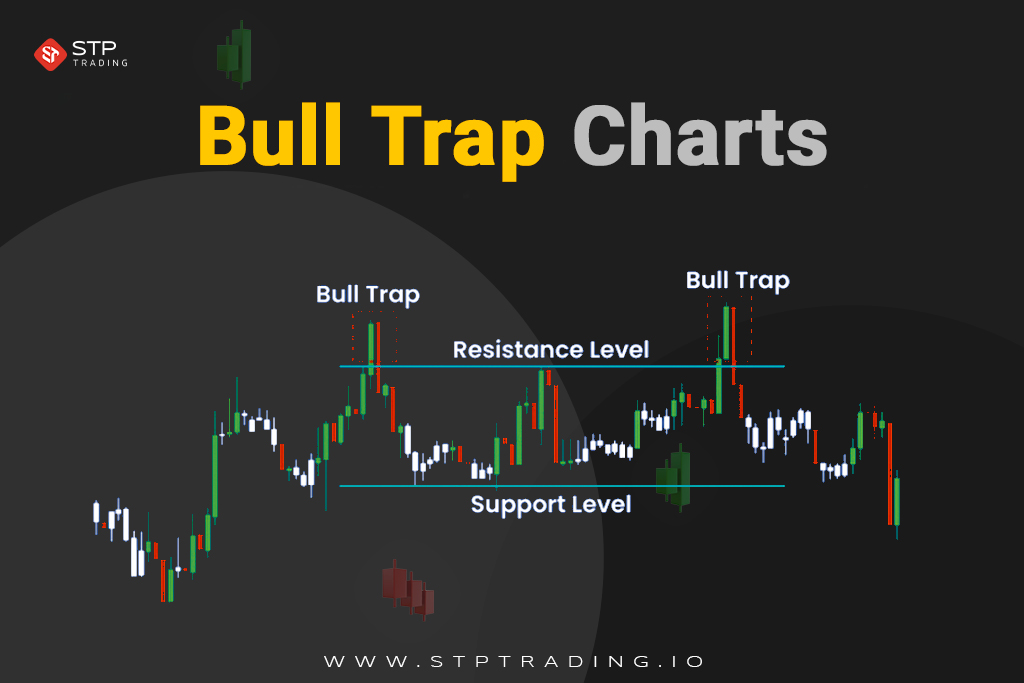
Resistance Break
The first sign of a bull trap is when the price seems to break out above a well-established resistance level. This is significant because resistance is often seen as a psychological barrier in the market.
When it’s beached, inexperienced traders may believe that the pair is on the verge of a significant upward movement. On the chart, it may appear as a bullish candle breaking through a previously impenetrable line. However, without confirmation, this move could simply be the setup for the trap.
Trader Excitement
After the breakout, optimism sets in. Many retail traders, and sometimes even institutions, view the breakout as the beginning of a new uptrend. They enter long positions with the expectation of a strong rally.
On the chart, this phase often shows a string of consecutive bullish candles following the breakout. The danger here is that enthusiasm can override caution, causing traders to overlook warning signs such as low volume or indicators showing divergence.
Sudden Reversal
Once enough buyers have entered the market, the price abruptly changes direction. Sellers re-enter aggressively, pushing the pair back below the resistance line. This sharp reversal is where the trap snaps shut.
On the chart, you’ll typically see a large bearish candle or a series of bearish moves that quickly erase the earlier breakout gains. This is typically the most painful part for those traders who went long on the “fake” breakout, as their trades immediately turn into losses.
Stop-Loss Triggers
As price falls even further, stop-loss orders of trapped traders begin to get triggered, adding further fuel to the decline. It’s a snowball effect here, each triggered stop-loss order adds more selling pressure, making the price go down even faster.
On the chart, this is seen as an accelerating fall, often wiping out the breakout gains in a very small proportion of the time taken to attain them. The bull trap is now complete, and late buyers are left with heavy losses.
What Is a Fake Breakout in Forex?
How to Trade a Bull Trap?
Bull trapping trading requires sharp observation, quick decision-making, and effective risk management. Although risky, this setup can be profitable if you know how to place yourself against the false breakout.
Trading bull traps is an advanced technique among top trading strategies. Beginners should first focus on avoiding traps rather than trying to profit from them. However, once you’re confident in reading charts, trading traps can become a powerful tool in your playbook.
Identifying the False Breakout
The first step is recognizing that the breakout above resistance is false. Signals include:
- Weak or declining volume on the breakout.
- Reversal candle patterns such as bearish engulfing or shooting star candles.
- Price and indicator divergence such as RSI or MACD.
If these warning signs appear immediately following the breakout, it may be the start of a bull trap.
Wait for the Reversal Confirmation
Don’t enter too early. If the price falls back below the breakout point (previous resistance), then that is an indication that the breakout was a trap. This typically triggers stop-losses for unsuspecting buyers, resulting in momentum to the downside.
For example: If EUR/USD breaks 1.1000 but then falls back to 1.0985, that’s a good indication that the trap is effective.
Open a Short Position
Once the trap is confirmed, advanced traders open a short position (selling) to capitalize on the downside movement. The reasoning is simple:
- trapped buyers will be forced to sell
- adding to the pressure of the decline which is lucrative for short sellers
Place a Protective Stop-Loss
Shorting bull traps is also risky, so use a stop-loss at all times. Place the stop just above the false breakout high. This allows you to minimize your risk if the market moves in an unpredictable manner upwards.
To anticipate this situation, get help from Forex forecasts. For example: If the false breakout high was 1.1020, place a stop-loss at 1.1030.
Target Realistic Profit Levels
The target can be positioned at the subsequent significant support level or a Fibonacci level of retracement. Since bull traps are likely to have extremely sharp falls, profits can happen suddenly, but don’t become greedy. Exiting at clear technical levels implies you reap profits before the momentum is lost.
Bear Trap vs Bull Trap: What’s the Difference?
Forex trading traps are designed to exploit trader psychology and lead them to make mistakes. While the bull trap takes advantage of traders expecting prices to rise, the bear trap targets those who are betting on a decline.
Understanding how the difference between the 2 is crucial because they both appear plausible on the chart at first glance. A bull trap convinces buyers that a breakout above the resistance level signals the start of a strong bull trend, when in reality the price sharply reverses and goes the other way.
Long buyers find themselves trapped at high prices as the market falls. On the other hand, a bear trap tricks sellers into shorting a market when it seems to be breaking below a strong support level.
Recognizing the signals of each trap can help traders avoid losses and potentially turn these trades into opportunities.
Bull Trap vs Bear Trap — Key Differences
| Key differences | Bull trap | Bear trap |
|---|---|---|
| Direction of Breakout | Upward from resistance | Downward from support |
| Market Illusion | Unanimously suggests a strong bullish rally | Unanimously suggests a strong bearish breakdown |
| Who Gets Trapped? | Buyers (long positions) | Sellers (short positions) |
| Actual Price Movement | Price reverses downward after breakout | Price reverses upward after breakdown |
| Psychological Impact | FOMO buying turns into panic selling | Fear selling turns into panic buying |
| Example | EUR/USD breaks 1.2000 but reverses to 1.1800 | GBP/USD breaks 1.1500 but reverses to 1.1700 |
Bull Trap vs Dead Cat Bounce
Forex traders often mix up a bull trap and a dead cat bounce because both are price action tactics that deceive traders. However, they are distinct setups, and understanding these differences is crucial to avoid costly errors.
A bull trap happens when the market fakes a breakout above a resistance level, leading buyers to believe that a new trend is emerging. As buyers enter, the price suddenly reverses and drops, trapping them at higher levels.
The trap is the false breakout illusion. On the other hand, a dead cat bounce is in an exceedingly strong downtrend. There are sharp reversals in price that can signal the process of a reversal following a sharp decline.
But the “bounce” is short-lived and when selling pressure reasserts itself, the downtrend resumes. Those who falsely expect this bounce to be a true recovery tend to buy on weakness.
In essence, the dead cat bounce is temporary relief in a bear market, while the bull trap is in the form of failed breakouts, both of which will short accounts unless identified early enough.
Bull Trap vs Dead Cat Bounce — Key Differences
| Key differences | Bull trap | Dead cat bounce |
|---|---|---|
| Market Context | Takes place near resistance levels | Takes place in a strong downtrend |
| Trigger Event | False breakout above resistance | Temporary rebound following a steep decline |
| Trader Behavior | Buyers arrive in droves, expecting continuation | Buyers believe downtrend is finished |
| Actual Price Movement | Price reverses back down after breakout | Price keeps falling after temporary recovery |
| Psychological Impact | Expectation of a breakout is cut short by sudden losses | False expectation of recovery results in new selling |
The Best Forex Bull Trap Avoidance Strategies
Avoiding bull traps involves more than just recognizing them on a chart. It requires a disciplined trading plan that includes Forex technical analysis, patience, and risk control.
Traders who successfully avoid these traps don’t rely on a single technique. Instead, they use a combination of methods and principles of professional trading in the Forex Market to filter out false signals and confirm genuine breakouts.
The following Forex bull trap strategy is designed to help you protect your capital and trade with greater confidence.
Confirm Breakouts with Volume
Breakouts that are accompanied by heavy volume are much more reliable than those that occur in quiet markets. Volume indicates participation, the more traders buying into a breakout, the higher the likelihood that it will hold.
If a resistance level is broken with low volume, it is a warning sign that the move may not be sustained. By monitoring both volume and price, you can avoid being lured into false signals that lead to bull traps.
Wait for Retests
Patience is also one of the most effective weapons against bull traps. A good breakout will usually come back to “retest” the broken resistance level, now turned to new support.
If the retest holds and price bounces higher, it serves as confirmation of the breakout signal. Waiting for that confirmation reduces the risk of buying too early, whereas instant jumpers get trapped when the market whips back below resistance.
Use Multiple Timeframes
A breakout on a single timeframe can be misleading. A move that is a breakout on the 15-minute timeframe may appear as irrelevant noise on the daily timeframe. By looking at multiple timeframes, traders are able to see the bigger picture and check whether the breakout is in the direction of the higher trend.
This kind of cross-checking works to filter out bull traps that are interesting only in the short term.
Risk Management
Even the best traders cannot avoid all bull traps. Risk management strategies are thus a necessity. Using stop-loss orders ensures that when a breakout turns into a trap, losses are contained.
Position sizing and not over-leveraging are also essential in the survival kit. Proper risk management does not just rescue you from bull traps; it rescues your capital so that you can keep on trading and taking advantage of genuine opportunities.

How STP Trading Avoids Bull Traps
Trading psychology and chart analysis are of paramount importance, but your broker could also be why you lose or gain money trading forex. STP TRADING provides forex traders with the ability to solve problems like bull traps by:
- Straight-Through Processing (STP) Execution: avoid manipulation by the dealing desk and ensure real market prices via free Forex signals service.
- Tight Spreads & Fast Execution: Reduces the risk of slippage during volatile breakout situations and rescues trading plans by anti-margin call options.
- Advanced Charting Features: helps determine bull trap chart explained patterns through enhanced technical analysis and trading tools opportunities.
- Educational Materials: Learn how to identify bull traps and other market traps through webinars and guides.
- Risk Management Functions: Includes functionality like hedging, stop-loss and negative balance protection.
With STP Trading Broker, you are not on your own with tricky setups, you have a reliable partner that helps you trade smarter, not harder.
What is Hedging in Forex and How Does it Work?
Conclusion: Beat the Trap, Trade with Confidence
The Forex Bull Trap Strategy sheds light on how markets can deceive traders into making rash choices. By learning to identify bull traps, understanding their differences from other false signals, and applying smart strategies, you can protect your capital.
Most importantly, trading with a clear and professional broker offers you the advantage to avoid potential pitfalls. You can profit from bull traps if you’re ready to trade smarter, take control of your forex today and join STP Trading in order to enjoy top-notch trading conditions.
What Is Speculation in Trading?
FAQ
Experienced traders can profit from bull traps instead of avoiding them, right?
Yes. There are certain advanced traders who anticipate bull traps and short the market on levels of resistance. But this requires good timing and experience.
Is a bull trap more likely to occur in certain forex pairs?
Bull traps can occur in any pair but occur more frequently in highly volatile or news-sensitive currencies such as GBP/JPY or emerging market currencies.
How do news events influence bull traps?
Major economic announcements can create false breakouts. For example, if short-term optimism due to an announcement from a central bank is created, a bull trap may be started before prices reverse.
Do algorithmic trading systems detect bull traps?
Sophisticated algorithms do attempt to spot bull traps from volume, momentum, and historical price patterns, but human oversight is still needed.
What is the safest way in which novice traders can steer clear of bull traps?
The best approach is to wait for confirmation, keep small position sizes, and always trade on stop-loss. Newbies should also practice trading in practice accounts prior to live trading.


