
In the ever-evolving environment of technical trading, it is essential to know where and why price is relocating. That’s where two powerful tools enter: Market Profile and Volume Profile. While seemingly alike on the surface—Market Profile vs Volume Profile plotting price distribution—they are derived from inherently disparate foundations. Market Profile plots the duration of time price is at a level, drawing a picture of the auction process and market behavior. Volume Profile, on the other hand, indicates where traders actually spent their money, revealing key areas of buying and selling interest.
So which offers the better trading edge? And more importantly—do you need to choose? In this blog, we’ll explore the philosophy, the characteristics, the pros and cons of each tool. You’ll discover not only how they stack up, but how they can be used to complement one another to give you an unbeatable view of the market—no matter whether you trade Forex, Futures, or anything in between.
What Are Fibonacci Retracement Levels?
Key Abbreviations You’ll See in This Guide
Let’s make our way through the underlying divergences and see how Market Profile vs Volume Profile plays itself out in the real world of trading—forex to futures, strategy to execution.
Memorizing the following terms will facilitate your understanding of the concepts and strategies as we compare Market Profile vs Volume Profile.
| Abbreviation | Full Form | Used in | Meaning |
|---|---|---|---|
| TPO | Time price opportunity | Market profile | Price levels where trading occurred during a time interval (often 30 mins) |
| POC | Point of control | Both | Price level with highest time (market profile) or volume (volume profile) |
| VA | Value area | Both | Range covering 70% of volume or time-based activity |
| LVN | Low volume node | Volume profile | Thin volume zone – often acts as rejection or fast travel area |
| HVN | High volume node | Volume profile | Thick volume zone – suggests strong buying/selling interest |
| IB | Initial balance | Market profile | Price range formed during first trading hour of a session |
Understanding Market Profile: The Time-Based Approach
Market Profile, devised by Peter Steidlmayer, organizes price activity in terms of time, instead of volume.
It also is refined through years of trading research and widely taught in institutional settings like CME Group’s education platform.
It can be utilized by traders to identify value areas, areas of balance and imbalance, and reference points like the Point of Control (POC).
On Market Profile charts, we normally deal with TPOs (Time Price Opportunities), which show for how long price remained at a particular level. Instead of reacting to lagging indicators, traders utilize Market Profile to estimate likely price action based on where value has developed. Market Profile aids in identifying three key regions:
- Value Area: The region in which 70% of trade took place.
- Point of Control (POC): The price level with greatest time-based participation.
- Initial Balance: The zone established during the first trading hour, typically establishing the tone of the day.
Key Features of Market Profile
In case of analyzing market profile vs volume profile, you have to know each profile possesses specific strengths and insights. Being aware of these characteristics allows traders to choose—or combine—them efficiently.
Whether you’re trading forex, futures or Intraday, you can use this tool within different types of trading accounts by knowing the features. Here are Key features of market profile:
- Time-based logic: Measures market acceptance in terms of time, ideal for identifying balance and imbalance.
- Auction Market Theory: Frames trading as a two-way auction between sellers and buyers.
- TPO (Time Price Opportunity): Plots a chronological record of price development.
- Initial Balance & Range Extensions: Useful for bracketing intraday setups
- More context in slow or low-volume markets: Especially useful in futures, indices, and forex.
- Highlight structure and flow: Assists in the identification of trend days, rotational days, and spike reversals.
TPO: The Building Blocks of Market Profile
What is TPO in Market Profile? TPO stands for Time Price Opportunity. It measures how often (in 30-minute periods, traditionally) price traded at a certain level. It is applied to construct a market-generated profile.
When the market returns to a price in a new time period, another letter is placed atop the profile. This method illustrates value zones, trend formation, and balance areas.
TPOs give the trader knowledge about the evolving auction process. A high, thin profile with sparse overlapping TPOs displays trend action. A wide, bell-shaped profile with stacked TPOs indicates a balanced market.
Traders are using TPO patterns to quantify market acceptance or rejection at major levels.
What is a Market Profile Example?
Suppose a day when EUR/USD traded most of the time between 1.0800 and 1.0850. The Market Profile for the session would indicate a bell-shaped curve around that price range—in designating a fair value area.
Letters are 30-minute increments, stacking on top of one another around 1.0825, becoming the Point of Control. Price briefly breaks above 1.0850 but falls back shortly, showing rejection and supporting the area of balance.
Market participants interpret this as the market establishing value between 1.0800 and 1.0850. A break higher or lower of the value area in the next session can signal strong direction intent. You can obtain proper forecasts on the Forex Market Predictions page.
This method doesn’t employ hindsight—it anticipates movement through price acceptance. To start with Market Profile, software like MetaTrader 5 (MT5) is very compatible and has indicators installed on it.
Pros and Cons of Market Profile
Traders are better served understanding where each profile excels and where it stumbles. Here is a chart of market profile’s pros and cons:
| Advantage of Market Profile | Disadvantage of Market Profile |
|---|---|
| Establishes price behavior by time, showing a greater understanding of price acceptance | Omits real volume traded, which restricts visibility in very liquid markets |
| Highlights intraday dynamics like Initial Balance, range extensions, and responsive action | Needs traders to read profile shapes, and this brings in subjectivity |
| Conveys structure to discretionary trading and trend day identification | Does not function well during news-induced volatility when time is no longer relevant |
| Allows session-based market context for traders | – |
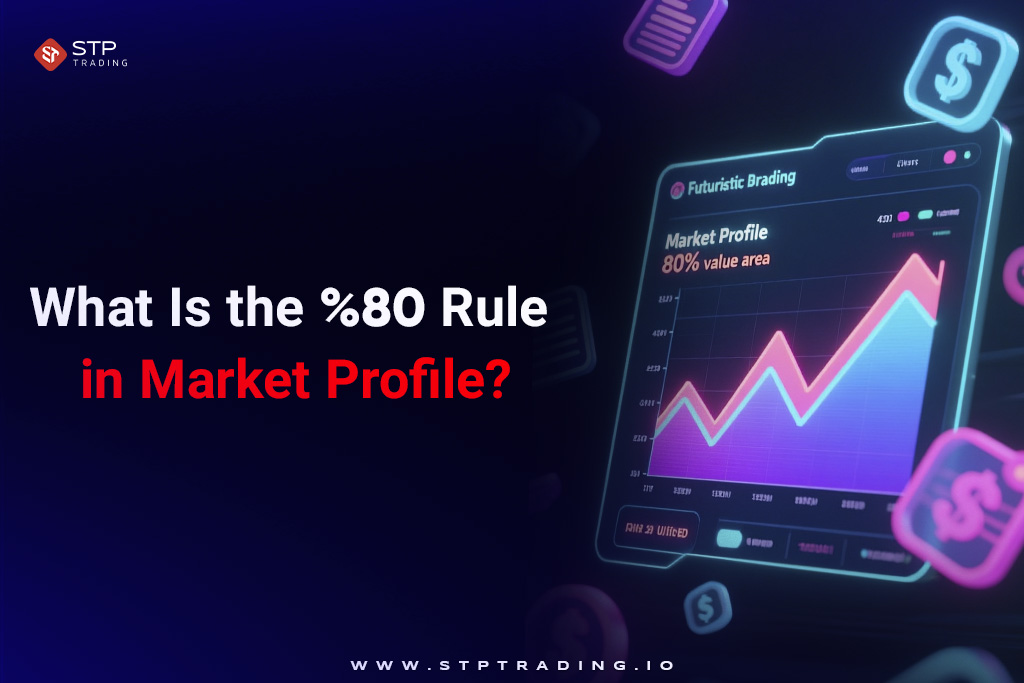
What Is the 80% Rule in Market Profile?
The 80% Rule in Market Profile is one of the most useful and practical auction market theory-based rules. It offers a statistical edge when analyzing price action relative to the value area—the zone in which 70% of the trading activity from the prior session was produced.
This is how the rule works in real time: If the market opens out of the value area from the previous day, breaks the value area, and stays inside it for two consecutive TPOs (30-minute time periods), then there is an 80% probability that price will travel through the whole value area.
This isn’t theory—it’s based on a lot of years of observation and trading sense. The idea is premised on the principle of market acceptance. If the market returns to an earlier value area and isn’t rejected quickly, it’s likely that members are finding value again in that region.
That normally results in a full re-test of the range. When to Use the 80% Rule Assume that the market opens higher than the prior value area. Price begins to pull back and re-enters that prior zone.
If it can stay there for two 30-minute TPOs, this suggests acceptance. In this case, a trader using Market Profile can make a trade with the goal of reaching the opposite edge of the value area.
This strategy works best in non-trending or balanced conditions, especially when there isn’t a large news event that disrupts the structure of the market. It provides both a tactical entry and a logical target, making it a reliable part of any Market Profile strategy.
What Is the Money Flow Index (MFI)?
Deciphering Volume Profile: The Volume-Centric View
Now is the time to answer what is a volume profile? Unlike Market Profile, Volume Profile prioritizes where trades were executed, rather than the amount of time price spent.
This tool plots traded volume horizontally at each price level over a user-defined session or a custom range. It displays areas of concentrated buying or selling interest, specifically where institutions are executing large trades. Volume Profile helps traders spot important levels like:
- High Volume Nodes: Regions of consolidation and aggressive interest.
- Low Volume Nodes: Gaps that fill quickly.
- Volume Profile POC: The most traded price, which acts as a magnet or pivot.
By showing where money actually enters the market, Volume Profile enables traders to trade with confidence, especially when coupled with trend analysis and news events.
Key Features of Volume Profile
These distinctive features allow traders to tailor their method. For example, Market Profile traders can seek rotational activity inside a day’s value area, while Volume Profile traders can wait for price reversal from a low-volume rejection zone.
Merging the two tools allows traders to read both market participation (volume) and market intention (time)—an advantage that is powerful in fast-moving environments. Here are important characteristics of volume profile:
- Volume-based clarity: Focuses on the actual traded volume rather than time, revealing where liquidity is concentrated.
- Good support/resistance identification: More suitable for scalpers and volume-sensitive traders.
- Works well in volume-dense markets: Particularly useful in equities, commodities, and crypto.
- POC as volume magnet: Points of Control tend to act as magnets during mean reversion.
What Are Commodities and How to Trade Them Effectively?
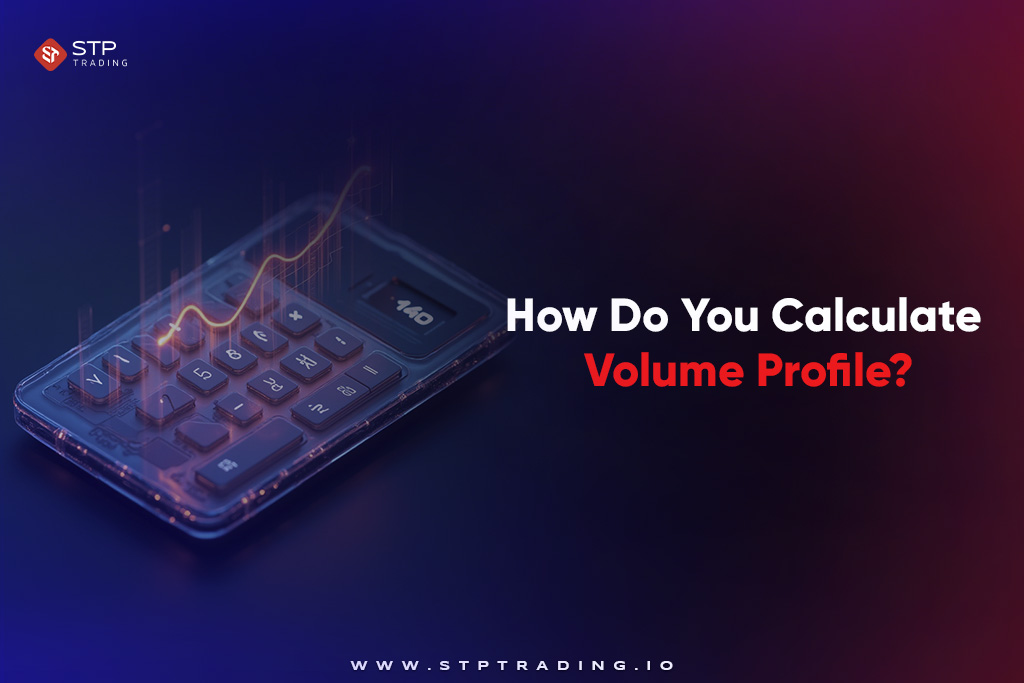
How Do You Calculate Volume Profile?
To calculate Volume Profile, add the volume traded at each price level over a selected time period. This data is a histogram that will be plotted along the price axis on your chart.
Unlike indicators based on time periods, Volume Profile gives data on market conviction based on real participation. Volume Profile includes:
- Cumulative buy volume and sell volume by price level
- Identification of high-traffic price zones
- Real-time or historical display depending on the selected session or range
The data is employed by the traders to determine supply/demand imbalance and make entries, stops, and targets based on that. Note that STP Trading Indicators and other software facilitate these calculations through pre-built auto-execution functionality.
Which Volume Profile Indicator Is Best?
Select a Volume Profile indicator that is flexible, lucid, and compatible with your trading platform. The top-rated indicators enable traders to:
- Establish user-defined time ranges (session, day, week, or user-defined)
- Show historical and real-time profiles
- Mark the POC, value area, and volume nodes with accuracy
MetaTrader 5 (MT5) offers high-performance Volume Profile plugins, so it’s perfect for dynamic forex and CFD traders. TradingView, on the other hand, is still a hit among multi-asset traders because it is visually clean and has session control.
Pros and Cons of Volume Profile
Every profile revealed a part of the puzzle in the market. Trading style, asset, and strategy define the right instrument. Both are mixed together by some traders to get clearer insight and build confidence in key areas.
In case of better understanding the market profile vs volume profile, you have to know the pros and cons of each tool. We will make a chart about volume profile’s pros and cons:
| Advantage of Volume Profile | Disadvantage of Volume Profile |
|---|---|
| Shows precisely where traders put volume, enhancing accuracy in identifying major price zones | Does not account for price duration at levels, lacking detail in market structure |
| Illustrates hidden support and resistance with HVNs and LVNs | May mislead in inactive or shallow markets with intermittent volume profile |
| Functions on any time frame and asset class with adequate volume | Missing the storytelling nature that Market Profile gives to intraday analysis |
| Assists scalpers and swing traders in synchronizing trades with liquidity regions | – |
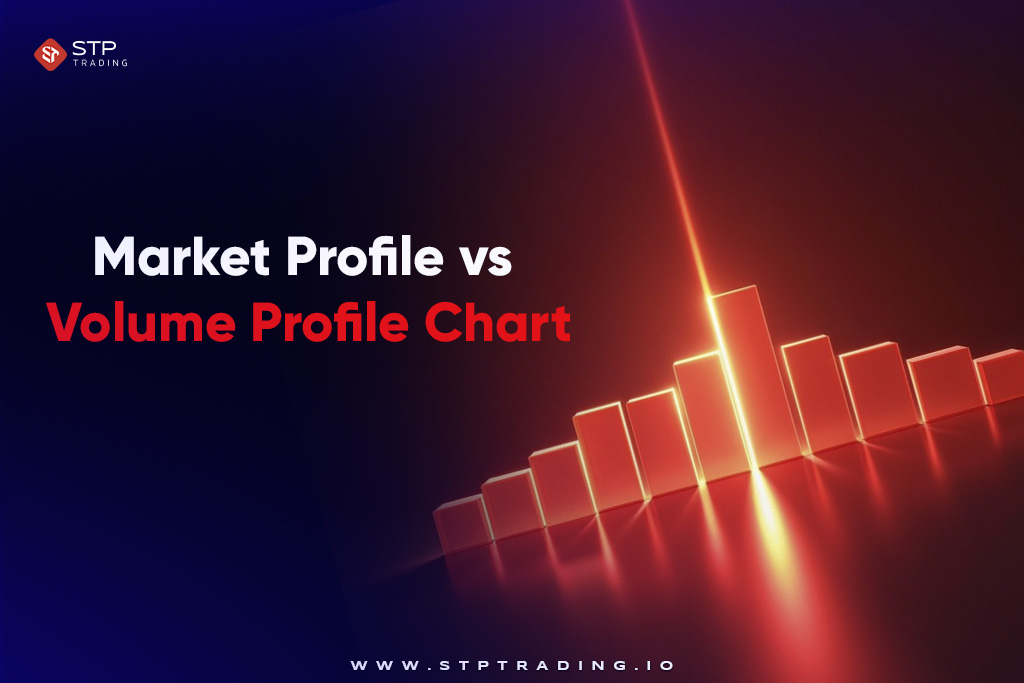
Market Profile vs Volume Profile Chart
What is the difference between market profile and volume profile? Before diving into the graphical comparison, market profile vs volume profile, traders must understand the essential philosophical as well as functional difference between Volume Profile vs Market Profile.
Both profiles aim to locate significant price levels—but they approach seeking this information from completely different angles. Traders using market profile tool create a narrative of market activity, value areas are established and future price movement is projected using acceptance and rejection.
Volume Profile, in contrast, is tracking how much business was done at each level. It doesn’t care how long the price lingered—it highlights where there was significant trading.
The tool unveils hidden supply and demand levels, detects institutional involvement, and detects precise areas where reactions may form in the future. Traders use it to see where the money actually moved.
Market Profile is more interpretive, auction theory-based. Volume Profile is more data-based, pure transaction volume-based. One constructs context, the other confirms conviction.
That’s why most professional traders don’t pick one—they utilize both. For more information about market profile vs volume profile in real-world scenarios, check Forex sentiment analysis.
| Feature | Market Profile | Volume Profile |
|---|---|---|
| Basis | Time spent at each price level | Volume traded at each price level |
| Key component | TPO (time price opportunity) | Volume histogram |
| POC (point of control) | Price with most time-based activity | Price with highest traded volume |
| Value area | Price range with 70% of time spent | Price range with 70% of volume traded |
| Best for | Auction theory, sentiment, time-based analysis | Volume confirmation, liquidity zones and breakouts |
| Indicator type | Market structure and behavior | Institutional order detection |
| Visual format | Letters representing time intervals | Volume bars aligned to price axis |
| Popular usage | Futures, Forex, Intraday and auction analysis | Stocks, Futures, Forex breakout & Reversal Zones |
Volume Profile POC vs Market Profile POC
The Point of Control (POC) is the price area where activity was most concentrated—but the foundation is different. In Market Profile, POC indicates where price spent most time.
It is a function of acceptance and comfort, to determine equilibrium. In Volume Profile, POC identifies the highest volume traded, indicating trader interest and transaction concentration.
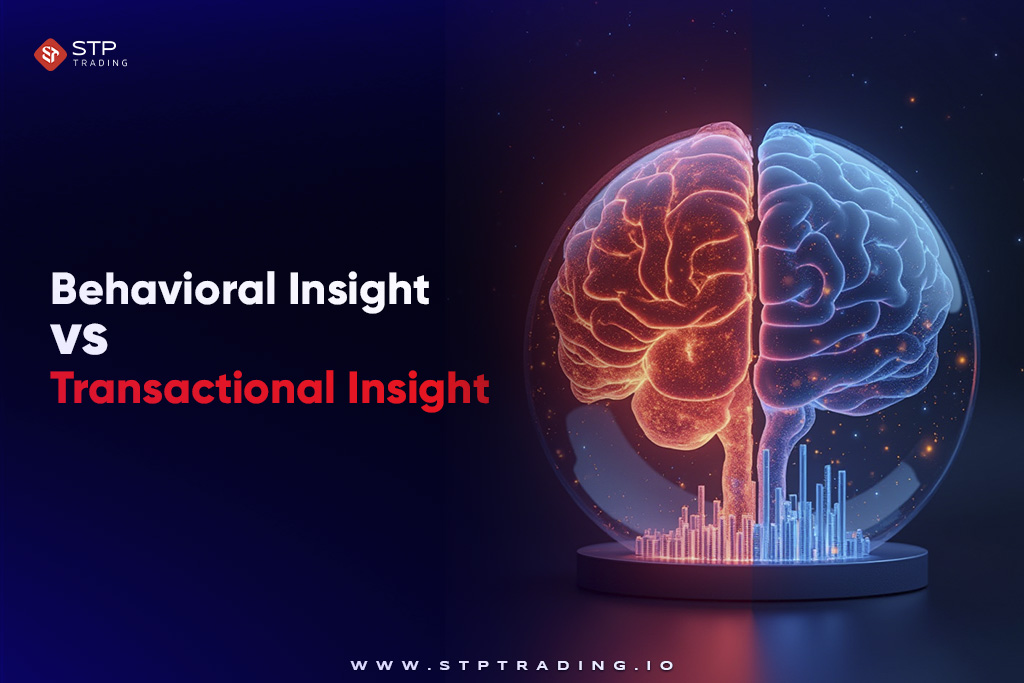
Behavioral Insight vs Transactional Insight
Market Profile gives traders a story—a story of time unfolding at every price level. It is an issue of market behavior, sentiment formation, and structural formation across sessions.
Traders who use this tool extrapolate moves based on auction theory, acceptance, and rejection zones. Volume Profile strategy provides raw transactional data. It emphasizes what was accomplished, not the amount of time it took.
It is what traders need when searching for institutional footprints, breakout areas, and liquidity traps. Understanding these differences allows traders to marry both tools for improved analysis.
Use Market Profile to define the setup, and then Volume Profile to confirm and trade with confidence. Checking these differences helps you answer this question: Market Profile vs Volume Profile: Which One Is a Better Tool?
Market Profile vs Volume Profile Forex
Beside using the free Forex signals, you can utilize other tools like these profiles. The way that the forex market operates is distinct from that of centralized markets like stocks or futures, and that makes its use of Market Profile and Volume Profile even more interesting.
Since forex isn’t a centrally traded market, speculators use tick volume—a count of price movements—to approximate true volume. Despite this lack, both Market Profile and Volume Profile provide valuable information when used properly.
Market Profile in Forex is particularly good when traders are looking to target market structure. It identifies value areas by time and denotes areas where currency pairs trend or consolidate.
The Opening Balance of major sessions’ first hour typically reveals strong hints for mean-reversion or breakout trades. Volume Profile in Forex, although handicapped by not being able to access centralized volume data, uses tick volume provided by brokers to build a horizontal histogram whose peak represents where most of the trading has occurred.
Smart traders use this to spot order flow zones, institutional prints, and reactive levels. For example, if price keeps returning to a high-volume node in GBP/USD near 1.2700, traders expect reactions—either as a magnet or a launching point.
Software like MetaTrader 5 makes such Volume Profile analysis easy, even in a decentralized market. Whereas Market Profile excels in revealing structure, Volume Profile indicates interest.
Together, they give forex traders an edge—structure and confirmation together. A Market Profile can show a value area being constructed in Asian session consolidation, and a Volume Profile can reveal a POC overlapping with a key Fibonacci retracement point.
Such convergence increases choice making and trade execution. To enhance your advantage in the forex market, track live events with the Forex Economic Calendar and enhance your trading strategy.
Market Profile vs Volume Profile Strategy in Action
Volume Profile and Market Profile strategies are designed to offer alternative entry and confirmation methods, and they both perform best when used together.
Volume Profile Strategy Examples
Volume Profile is quite handy in spotting large trade price zones—especially in trend verification, mean reversal and breakouts. Some valuable methods for applying Volume Profile to real-time trading are outlined below:
- Look for low-volume nodes (LVNs) to act as rejection or bounce points.
- Trade with the market’s direction of the high-volume node (POC) as an attractor
- Use volume spikes at the extremities of prices to confirm reversals
- Follow developing volume profiles intra-day to realign stops and targets
- Connect the volume imbalance with price structure for clean entries\
These approaches most effectively function in liquid markets where volume matters—such as futures, forex (with tick volume), or crypto markets with healthy order flow.
Market Profile Strategy in Real Trades
Market Profile gives the trader a narrative—a feeling for how the auction process functions and where value is being made or discarded. It’s especially helpful in identifying key turning points and strategic levels. This is how traders commonly apply it:
- Search for price to enter yesterday’s value area and look for 80% Rule
- Use Initial Balance breakout failures in reversal trades
- Watch for TPO anomalies for anticipating future price revisit areas
- Look for balance-to-imbalance transitions to catch trend initiation
- Connect TPO structure with price action for understanding context
Market Profile works best in well-structured environments like Forex sessions, Futures markets, and equity index analysis—especially in the presence of low news.
Merging Both for Accuracy in Trading
While each profile tool is valuable individually, the real trading edge is when you combine them. Use Market Profile to define the big-picture shape and session context—then use Volume Profile to find entries, exits, and confirmation of key levels.
Generally, Trade execution and pinpoint entries are Volume Profile’s strength. Market Profile offers strategic context, helping traders map market narrative. Use Market Profile to set the environment. Also Use Volume Profile to validate conviction.
For example: Use Market Profile to define a high-probability situation in a value area. Then check Volume Profile to see if there is a high-volume node to confirm the entry—or a low-volume area of rejection for a tight stop.
This two-profile strategy gives you the context (through time-based acceptance) and the conviction (through volume-based interest)—an edge that can benefit your trade accuracy dramatically.
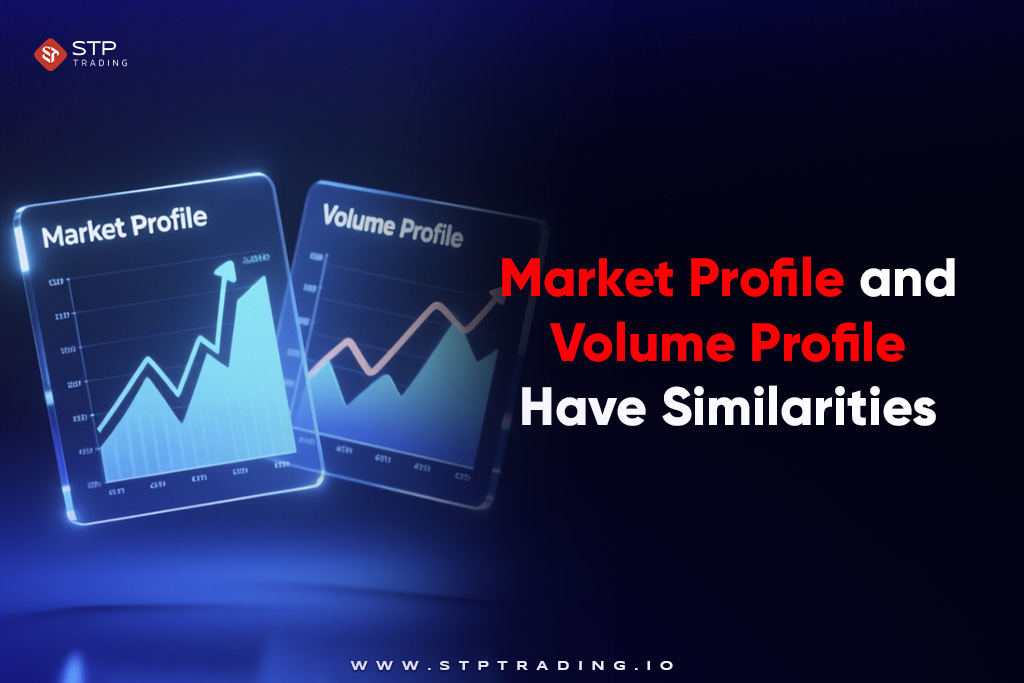
Market Profile and Volume Profile Have Similarities
While Market Profile and Volume Profile both employ alternative measurements—time versus volume—they share an unexpectedly similar foundation. Both of these tools are geared to demonstrate how markets generate value and give traders visual structure.
Understanding their parallels enables you to combine the strengths of each to trade more precisely. Both profiles inherently:
- Create a distribution curve that provides a sense of where trading activity concentrates
- Assist to define areas of value (equilibrium zones) and extremes (opportunity zones)
- Substitute one Point of Control (POC) for the determination where the market consensus was formed
- Assist in determining support and resistance levels through structure
- Execute structural roles in trending and range markets
- Communicate market conditions through profile shapes (D-shape, P-shape, b-shape)
When you blend Market Profile’s time-based information with Volume Profile’s trade-based simplicity, you observe market action through both double layers.
For example, if both tools indicate a strong POC on the same level, the level is a heck of a lot more reliable.
Structure Meets Precision—Trade Smarter
Market Profile and Volume Profile aren’t rivals—they’re two views on the very same market reality. Market Profile gives you an overview of how price plays out over time and paints the picture of structure, balance, and narrative. Volume Profile zooms in to identify where trades actually happen and enables you to confidently confirm key levels.
In tandem, they’re no longer a guess—your trades have purpose and precision. That’s the mindset of STP Trading Broker : marrying institutional-grade tools with smart strategy to give traders an edge.
Scalping micro-moves or swing trading big sessions, you must understand how volume and time are used together to become a better trader. The tools are there. The know-how is in front of you. What you have to do now is put it into action.


